State of The Climate – Meteorological Fall 2014

Wow, what a fall temperature-wise in southern Manitoba this year! From record July-like heat in late September to January-like cold in November, we saw the extremes of all seasons… Here are the average temperature and total precipitation rankings for fall 2014 in Winnipeg:

Meteorological Fall Rankings for Winnipeg
Category Fall 2014
Average/Total
Rank
High Temp. 9.1°C Tied 49th coldest
Mean Temp. 3.8°C Tied 48th coldest
Low Temp. -1.5°C Tied 53rd coldest
Rainfall 47.3 mm 24th least
Snowfall 18.2 cm Tied 46th least
Precipitation 59.7 mm (est.) 18th driest

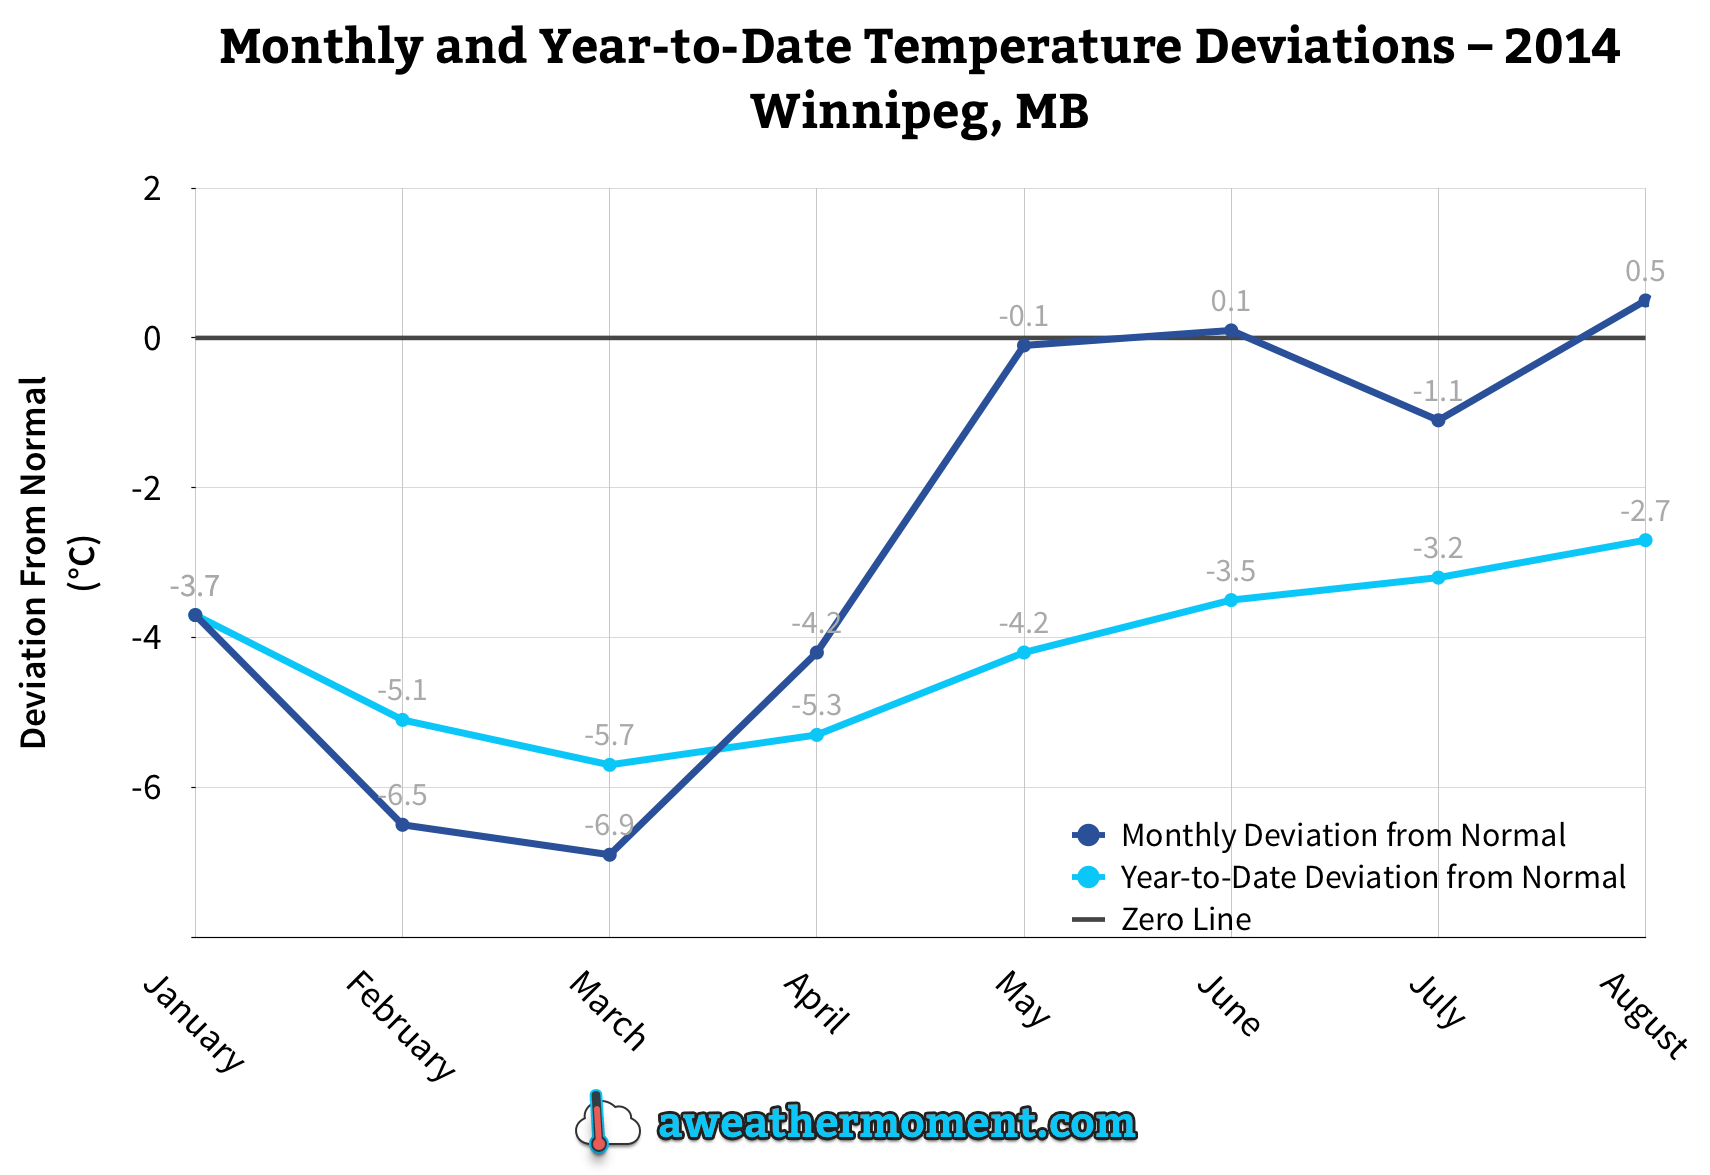
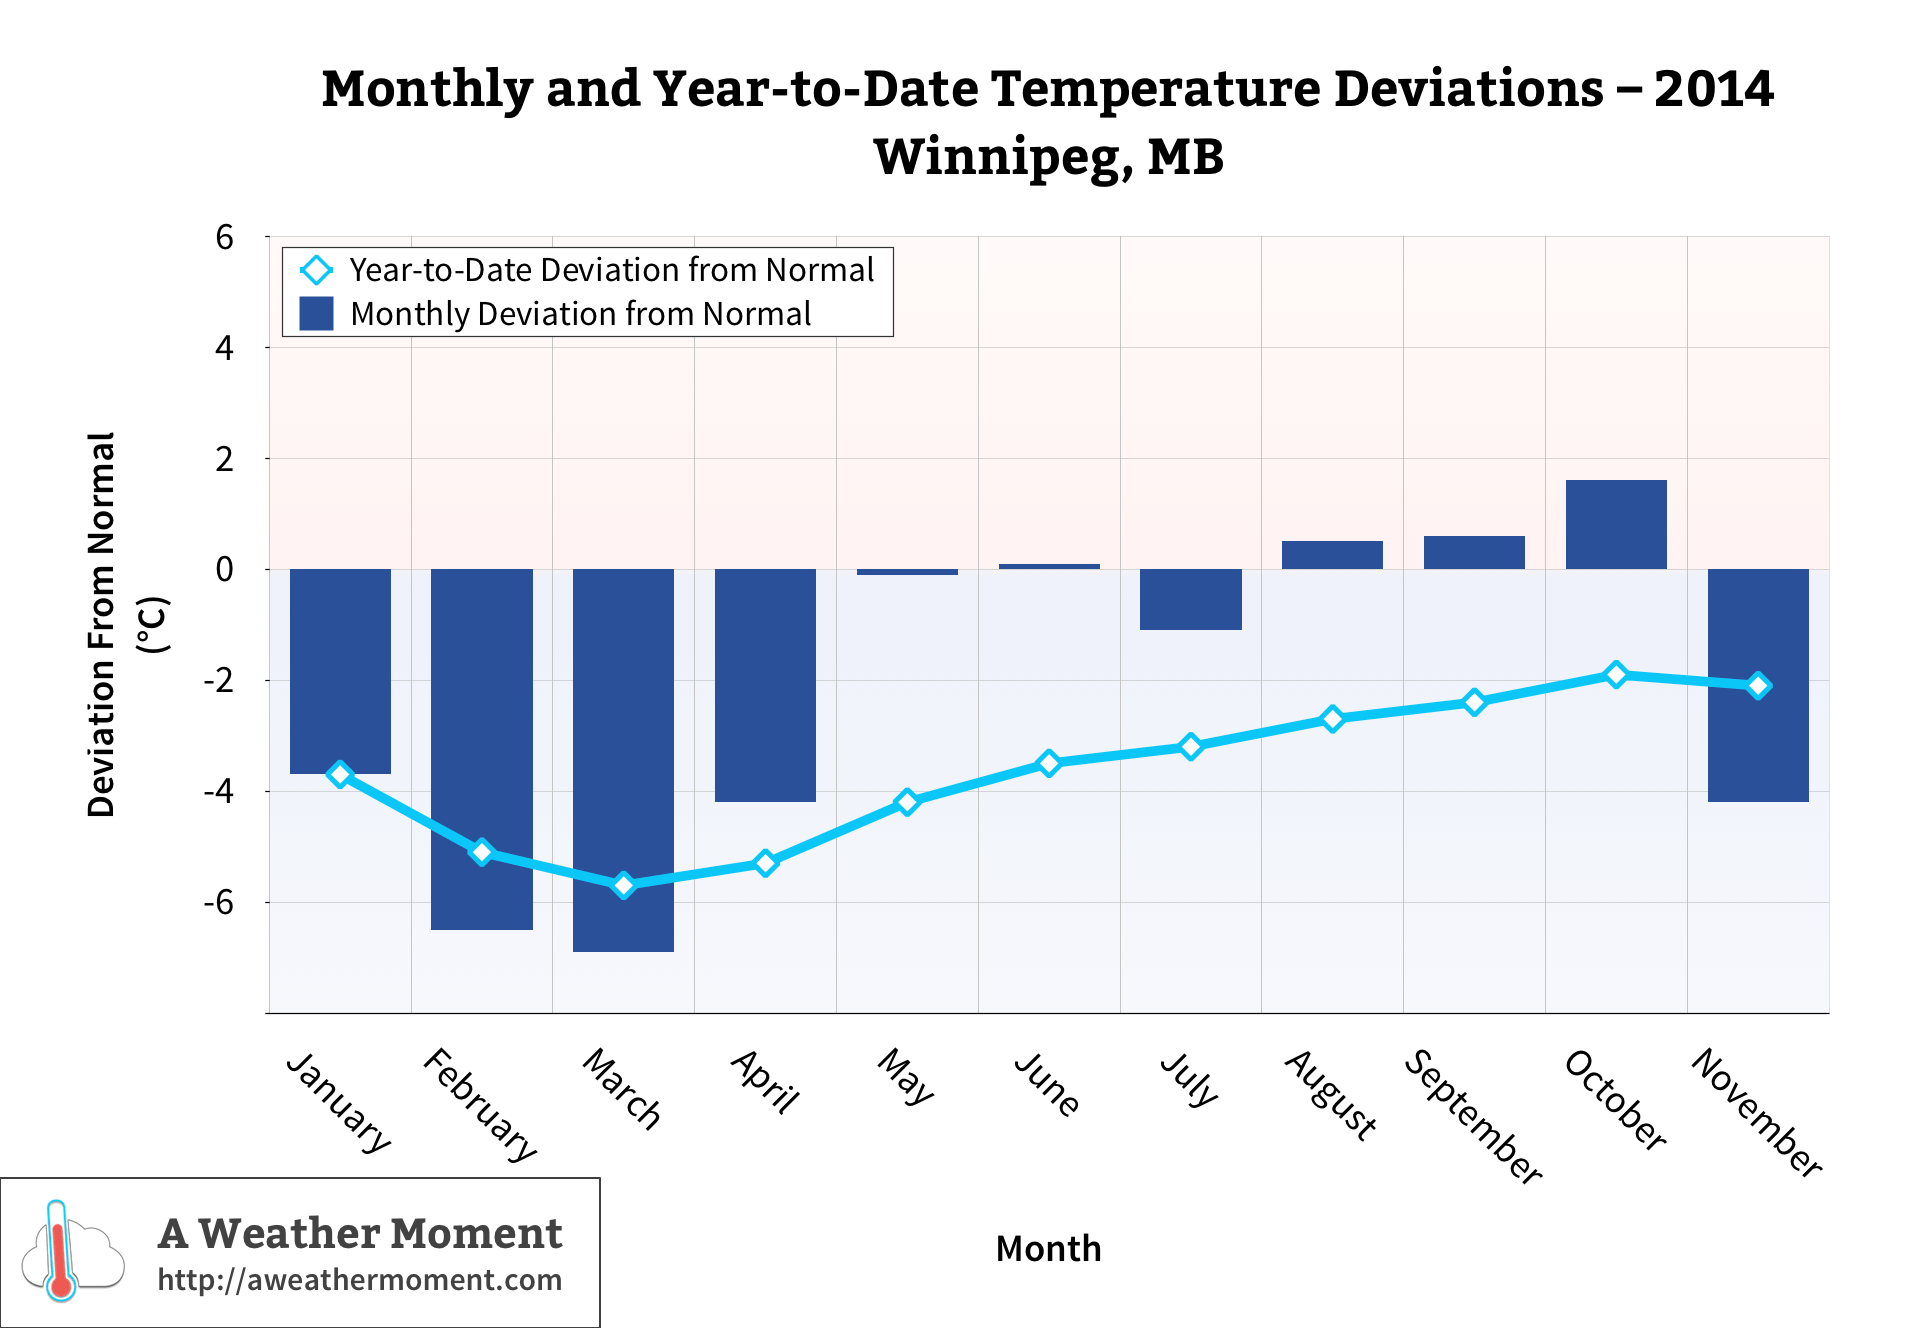
The meteorological fall (Sep-Oct-Nov) averaged 3.8°C or 0.7°C below the 1981-2010 normal. The negative anomaly was due to a frigid second half of November. September and October actually averaged warmer than normal with anomalies of +0.6°C and +1.6°C respectively. November on the other hand finished 4.2°C colder than normal with an average of -8.8°C, the 22nd coldest November on record since 1872 and the coldest since 1996.

Record Heat & Humidity In Late September

The dramatic burst of July-like heat we had in late September was perhaps the top weather event of fall 2014. The bulk of the warmth occurred September 22 to 27 with 6 of those days seeing highs over 25°C, a good 10-15°C above normal for that time of year. Overnight lows remained well into the teens.

Fall colours as seen in Henteleff Park on September 13, 2014.

September 26 was the hottest day with a high of 30.2°C at Winnipeg Airport, just shy of the old record of 31.7°C in 1952. However, it was even hotter in southwestern Manitoba where the heat was literally unprecedented for so late in the season (at least since records began). In Brandon, highs of 34.0°C and 32.8°C on the 25th and 26th respectively were the hottest on record for so late in the season since 1890. The provincial hotspots during the hot spell were Swan River and Wawanesa with maximums of 35.1°C!

In Winnipeg, only 1 temperature record was broken; a record high minimum of 17.4°C on September 26. This was the warmest minimum temperature for so late in the year since 1872. Humidity was the main story with dewpoints in the teens and humidex values in the 30’s. In fact, 6 daily high dewpoint records were broken in Winnipeg during the warm spell, with a maximum dewpoint of 18.1°C on September 26. A maximum humidex value of 35.8 on the 26th was the latest occurrence of humidex over 35 on record since 1953.

October Warmth & January in November

After a brief cool down early October, things warmed up again mid-month with highs commonly in the teens. 2 days exceeded 20°C. A high of 20.6°C on October 24 was the warmest for so late in the year since 1990. Thanks to generally warm conditions in October, The Forks weather station did not report its first freeze until October 30!
Of course, winter came in viciously in mid November with a prolonged cold snap lasting until the beginning of December. A low of -29.6°C at Winnipeg Airport on November 26 was the coldest in November since 1996. We only reached a measly high of -19.3°C on the 26th and 30th, the coldest highs in November since 1985.

Dry Fall

It was also a fairly dry fall, as many of you have probably noticed. Only around 60 mm of precipitation fell in Winnipeg, making it about the 18th driest fall on record since 1872. October was driest with just 4.9 mm of precipitation (all rainfall), the 3rd driest October on record.

The Year So Far

2014’s standing in terms of temperature has improved (warmed) slightly since the summer summary in September, thanks to warmer conditions in September and October. This January to November period averaged 2.3°C or 2.1°C below the 1981-2010 normal for the period. It is the 22nd coldest since 1873 and coldest since 1996, which is an improvement from the 17th coldest January to August period.

Monthly & year-to-date temperature deviations through Fall 2014 in Winnipeg, MB.

391.4 mm of rain has fallen this year up to now, which is actually about 37 mm below normal for an entire year. The deficit in rainfall can be attributed to a very dry fall and below normal rainfall in the spring.

State of the Climate – Meteorological Summer of 2014

As of September 1st, meteorological summer[1] has come to an end and the fall season is upon us. That means, of course, it’s time to take a look back on the summer of 2014 to see just how it fared in the grand scheme of things. Was it actually all that cold, or is that just our memories suffering from the prolonged winter? How wet was it actually? Was it a particularly stormy summer? We’ll take a look at how all of those things fared in Winnipeg as well as highlight a couple major events from the past 3 months across the province!

Meteorological Summer Rankings for Winnipeg International Airport
Category Summer 2014 Total or Average Rank
Average High Temperature 24.3°C Tied 51st coldest
Mean Temperature 18.2°C Tied 67th coldest
Average Low Temperature 12.1°C Tied 53rd warmest
Total Rainfall 276.9 mm 29th rainiest
Thunderstorm Days 17 days Tied 23rd least

Temperature-wise, there wasn’t much to talk about this summer in southern Manitoba. The summer averaged pretty much bang on normal in most areas, including Winnipeg where the average mean temperature of 18.2°C was just 0.2°C below normal. A similar story in Brandon where the average mean temperature of 17.4°C was just 0.1°C above normal. However, there was a notable lack of very hot days. There were only 5 days above 30°C in Winnipeg, below the normal of 12 days, and the least since 2009 when there were only 3 days over 30°C. Interestingly, the hottest day so far this year was actually in May when we hit a record 33.3°C on May 24th. Although it is not the first time our hottest day of the year was outside of the summer season, it is unusual. The last time this occurred was in 2004 when our hottest day of the year was on September 19th.

August Ends 10-month Cold Streak

Top 5 Longest Streaks of Colder Than Normal Months Since 1872
Rank # of consecutive below normal months Timeframe
1 18 months Dec 1882-May 1884
2 14 months Jul 1884-Aug 1885
3 11 months Oct 1887-Aug 1888
4 10 months Oct 2013-Jul 2014
5 9 months 1949/50, 2008/09 & 2012/13

August finished 0.5°C above the previous 30-year (1984–2013) average mean temperature of 18.7°C. This marked the end of a 10-month streak, from October 2013 to July 2014, of months colder than the previous 30-year average. This 10-month streak was the 4th longest of its kind since 1872 and the longest since an 11-month streak in 1887–1888.

Summer Flooding

A grand total of 276.9 mm of rain fell at Winnipeg airport June, July and August. Although this may seem like a lot of rain, this is actually only 12% above the 1981–2010 normal of 247.5 mm. So overall, we were pretty close to normal rainfall totals this summer. However, the problem this summer was that the rain was not spread out through the entire season. Rather, the majority of our rain fell in mid-late June and mid-late August. These two periods featured flooding in parts of southern Manitoba as too much rain fell in too little time. In fact, over 130 mm of rain fell in just 17 days in the second half of June at Winnipeg airport. The month finished 12th rainiest on record with 147.1 mm.

Excessive rainfall over southwestern Manitoba this summer resulted in significant flooding along the Assiniboine river. Brandon, MB – pictured above – was one of many communities hit hard by the widespread flooding.
Excessive rainfall over southwestern Manitoba this summer resulted in significant flooding along the Assiniboine river. Brandon, MB – pictured above – was one of many communities hit hard by the widespread flooding.

Conditions were worst in southwestern Manitoba this summer with well above normal rainfall; over 300 mm of rain fell in some of the hardest hit locations. Brandon was one of these locations, receiving a whopping 347.2 mm, almost an entire year’s worth of rain in just 3 months. 251.6 mm of this fell in June alone, Brandon’s rainiest June on record. In fact, 219.8 mm fell in just the last 12 days of June, more than half a year’s worth of rain!

The Year So Far

2014 continues to be much colder than normal. Up to August, the year has averaged 1.7°C; 2.7°C colder than normal for the period. This ties for 17th coldest January to August period on record since 1873, and is the coldest since 1979 when we averaged 0.7°C in the same period. Here’s hoping the year ends on a warmer note!

The monthly and running year-to-date temperature deviation from normal (1981-2010).
The monthly and running year-to-date temperature deviation from normal (1981–2010).

In terms of rainfall, the airport has seen 344.1 mm so far this year (up to August 31), which is pretty much bang on normal for the period. Higher amounts, closer to 400 mm, have fallen in southwestern parts of Winnipeg where heavier rains fell in August.


  1. Metorological summer is considered June, July and August.  ↩

State of the Climate: Meteorological Spring 2014

Meteorological Spring Stats and Rankings for Winnipeg
Category Spring 2014 Total or Average Rank (since 1872)
High Temp. 5.6°C Tied 19th Coldest
Mean Temp. -0.4°C Tied 20th Coldest
Low Temp. -6.2°C Tied 22nd Coldest
Rainfall 67.2 mm 59th Least Rainy
Snowfall 31.4 cm 59th Snowiest

Despite a seasonal May temperature-wise, the meteorological spring[1] of 2014 still averaged well below normal thanks to a frigid April and March. The spring averaged -0.4°C, 3.8°C below the 1981-2010 normal of 3.4°C. Thus this was the 9th coldest spring in the last century and tied for 20th coldest since 1872. In comparison, last spring in 2013 was a tad colder, averaging -0.6°C. It was just 2 years ago that we experienced our 2nd warmest spring on record. We’re sure paying for that now!

A Variety of Weather Conditions in May

Because I’ve already talked a lot of about March and April in 2014 – The Year so Far a few weeks ago, I’ll talk mainly about the month of May in this post.
May started out just like every other month since last fall: below normal. Things began warming up mid-month with our first 20°C of the year on May 10 when we reached 23.2°C. This marked the 18th latest first 20°C of the year since 1872 and the latest since 1996 when we did not reach 20°C until May 18. The 1981-2010 normal is April 20 and thus, we were a good 3 weeks behind schedule this year.

After some snow on May 14, mother nature had a dramatic mood swing in the 3rd week of May as July-like conditions arrived. Just 10 days after seeing snow, temperatures soared to a record 33.3°C on May 24, breaking the old record of 32.7°C in 1980. This also marked the first 30°C reading in May since 2007 and was the hottest May day since 1995. Temperatures soared again on May 29, reaching 32.7°C. With two days above 32°C, it was the most 32°C+ days in May since 1995 when there were also two.
With the warmer weather came thunderstorms. Winnipeg received its first thunderstorm of the season on May 20, the 8th latest start to the thunderstorm season since 1953. This follows the 2nd latest start last year. 1981-2010 normal first thunderstorm of the year is April 27.

In the end, May averaged 11.3°C which is pretty much bang on the normal of 11.4°C. However, at 0.1°C below this normal it is just enough to continue the streak of colder than normal months. May stands as the 8th consecutive colder than normal month, a streak which began last October. This ties for 7th longest below normal streak since 1872.

Top 12 Longest Streaks of Colder Than Normal Months Since 1872
Rank # of Consecutive Below Normal Months Timeframe
1 18 months Dec 1882-May 1884
2 14 months Jul 1884-Aug 1885
3 11 months Oct 1887-Aug 1888
4 9 months 1949/50, 2008/09 & 2012/13
7 8 months 6 occurrences (including 2014)

Thankfully, May ended a 5-month streak of months averaging over 3.5°C below normal, the longest streak of its kind since 1872. Prior to this year, the longest was just 3 months.
May this year also continued a now 2 decade-long trend of cool Mays. We have not had a top 35 warmest May in 23 years. The last time was in 1991 which featured a tie for 5th warmest May. Since then, 6 Mays were among the top 35 coldest.

The Year So Far

The monthly and accumulated year-to-date temperature deviation from the normal monthly average temperatures.

So far this year we have averaged -8.2°C (January to May), 4.2°C below normal and the 16th coldest first 5 months of the year since 1873. It is also the coldest since 1996 and the 5th coldest in the last century. This is little improvement from the 15th coldest first third of the year (January to April) we experienced.


  1. Meteorlogical spring lasts through the months March, April and May.  ↩

State of the Climate: The Year So Far

Editor’s Note: Something I’ve wanted to do far more frequently than I’ve been able to is comprehensive climate statistics for Winnipeg. In between the regular posts, occasional event summaries and keeping this website humming along, I simply haven’t had the time time to get my personal climate archive quite up to snuff yet to really dig into things. So, I’d like to introduce a new contributor to the AWM team, Julien (@jjcwpg on Twitter). He’s the proprietor of Winnipeg Weather, does fantastic work with climate statistics[1] and will be in charge of seasonal climate updates as well as summer severe weather climatologies, similar to his guest post covering last summer’s thunderstorm statistics across the province. Since Julien is joining the team mid-season, we’re doing a “Year so Far” climate summary to bring readers up to speed on the current climate story for Winnipeg – hint: it’s cold – and to introduce him. So without further ado, here’s the first post of our new feature: State of the Climate!


Quite the year so far!

It’s no secret that 2014 has been an unusually cold year so far; in fact, we’ve managed to reach some impressive milestones in the last few months. Our brutal winter is now long gone and most of you probably want to forget about it (me as well), but before doing so I do have some interesting statistics about the winter of 2013/14 that I think are worth sharing.

To start off, this past December to March period didn’t only feel like one of the harshest ever recorded in Winnipeg, it statistically was. Our mean temperature (an average of all daily highs and lows) was -18.4°C, making it the coldest December to March period in 115 years. However, because we only tied with the winter of 1898-1899 for 11th coldest, we have to go back 121 years to find a December to March period that was even colder than this year’s. With 124.6cm of snowfall, it was also the 12th snowiest December to March period. Combining 12th snowiest with 11th coldest truly made this past winter one of the harshest since records began in Winnipeg in 1872.

In total, there were 90 days below -20°C between December and March, tying 6th most since 1872 and the most in 121 years! That’s 74% of all available days! The 1981-2010 normal is 51 days. The following table summarizes the number of -20°C and -30°C days we had from December to March.

Days below -20°C and -30°C
December 2013 to March 2014
Month Days below -20°C Days below -30°C
December 25 (tied 6th most) 9 (tied 15th most)
January 26 12
February 24 (tied 13th most) 6
March 15 (tied 20th most) 2
Total 90 (tied 6th most) 29 (tied 19th most)
Anything within the top 20 is noted.

The winter minimum was -38.0°C on January 5, the coldest temperature in Winnipeg since a -41.7°C low in February 2007. The high of -30.2°C for the day was not only a record low maximum but also the coldest since a -30.8°C high on Jan 30, 2004.

Many of you might remember the super cold day we had on March 1. Well, I’d say that was the most anomalous day of the winter. The low of -37.0°C that day was actually the 9th coldest in March since 1872. The high of -26.0°C obliterated the old record low maximum of -22.2°C in 1972 and was the second coldest in March on record. The mean temperature for the day was -31.5°C, making it the second coldest March day since 1872. In fact, this was a whopping 21°C below normal for the day, almost as extreme as March 2012’s 23.7°C above normal on March 19, 2012. Of course, to Old Man Winter all this was not enough. A minimum hourly wind chill value of -49.6 at 7 am was the lowest ever in March since 1953. Previous record was -48.8 in 1962.

Cold Not the Only Story of 2014

Despite all the cold weather news to talk about this year, one warm record managed to stand out. On January 15, a high of 3.3°C broke the old record high of 2.2°C in 1973. However, this high was an amazing 30.7°C increase from a low of -27.4°C in the morning, the greatest single-day warmup on record since 1872[2]. The top 5 are given in the table below. The 30.7°C warmup took about 14 hours and peaked between 4 and 5 pm when the temperature rose 5-6°C in just 1 hour.

Top 5 Greatest Calendar-Day Warmups since 1872
Rank Temperature rise of… Date
1 30.7°C Jan 15, 2014
2 30.6°C Jan 20, 1874
2 30.6°C May 12, 1949
4 30.5°C May 19, 1899
4 30.5°C Jan 30, 1934
Note the fact that this statistic doesn’t consider how quickly the temperature rose.

Nonetheless, the cold will forever be remembered as the top story of early 2014.

Stubborn cold continues into spring

In more recent memory, the cold continued into April with near record lows at times mid month. At 4.2°C below normal, April was the 5th consecutive month averaging over 3.5°C below normal and 7th consecutive month averaging below normal in general; a streak which began in October. In fact, up to April 30 we’ve averaged -13.1°C for 2014, 5.3°C below normal for the period. This ties with 1996 for 15th coldest first third of the year since 1873 and 4th coldest in the last century. The following graph shows how each month so far this year has averaged compared to the 1981-2010 normal as well as the year-to-date average compared to normal.

2014 Monthly and Year-To-Date Temperature Deviations for Winnipeg, MB

Yet another couple impressive statistics have come from this year’s cold. Our winter snow pack still sat at 43cm deep on April 1, the 3rd deepest winter snow pack entering into April since 1955. It didn’t reach a trace cm until April 19, the 3rd latest on record, and disappear until April 21, the 8th latest on record.

Thank you for reading and we hope you all enjoyed this first State of the Climate post!


  1. Seriously, the number of stats he’s worked out is fantastic!  ↩
  2. In this case, when referring to a single day we mean a single calendar day.  ↩