December 2017 Continues Dry Conditions in Winnipeg; Near-Seasonal Temperatures Overall

November 2017’s mild end continued throughout the first two-thirds of December with daily mean temperatures as much as 13.8°C above normal. Things abruptly changed for the last third of the month, though, with daily mean temperatures plummeting to nearly 10°C below normal as daytime highs near 0°C were replaced by highs in lower minus 20’s and overnight lows as low as -35.5°C.

Although no records were set throughout December – the warmest weather was nowhere near warm enough and the cold weather couldn’t compare to the deep freeze of the late 1800s – the month was marked by gradually increasing warmth followed by an abrupt shift into significantly colder conditions just in time for Christmas. The high of -26.4°C on December 25th marked the 8th coldest high for Christmas Day in Winnipeg’s record. New Year’s Eve was also

The warmest day of the month occurred on December 18th when the temperature climbed to a high of +0.7°C, 11°C above the seasonal high of -10.3°C. With a daily minimum temperature of just -3.2°C, the day ended up with a mean temperature 13.8°C above seasonal at -1.3°C. The coldest day of the month came right near the end on December 30th; temperatures reached a high of just -27.9°C, colder than Christmas day and 15.7°C below the seasonal high for the day. The daily minimum temperature of -35.5°C was also the coldest measured for the month. They combined for a daily mean temperature of -31.7°C, the only day of the month with a sub-minus 30 mean temperature.

December had a monthly mean temperature of -14.8°C, which was 0.4°C below the seasonal normal of -14.4°C. The mean daily high temperature was -10.4°C, which was 0.7°C colder than normal. The mean daily low temperature was -19.2°C, just 0.1°C below normal. Warmer than normal daytime highs occurred on 17 of 31 days and warmer than normal overnight lows occurred on 17 of 31 days as well. 18 of 31 days saw warmer than normal daily mean temperatures, which just goes to show the relative intensity of the cold weather at the end of the month; despite only being in place for less than half the month, it was cold enough to bring the overall temperatures below seasonal averages. And despite Christmas ranking in the top 10 coldest, the month overall was unremarkable in the climatological standings: it ended as the 81st warmest December on record.1

The longest stretch of above-seasonal daily mean temperatures was 13, from December 7 to December 19. The longest stretch of below-seasonal days was 9, from December 23 to December 31.

The monthly temperature range was 38.0°C, from a maximum temperature of 2.5°C on December 2nd to a minimum temperature of -35.5°C on December 30th.

Rainfall Title

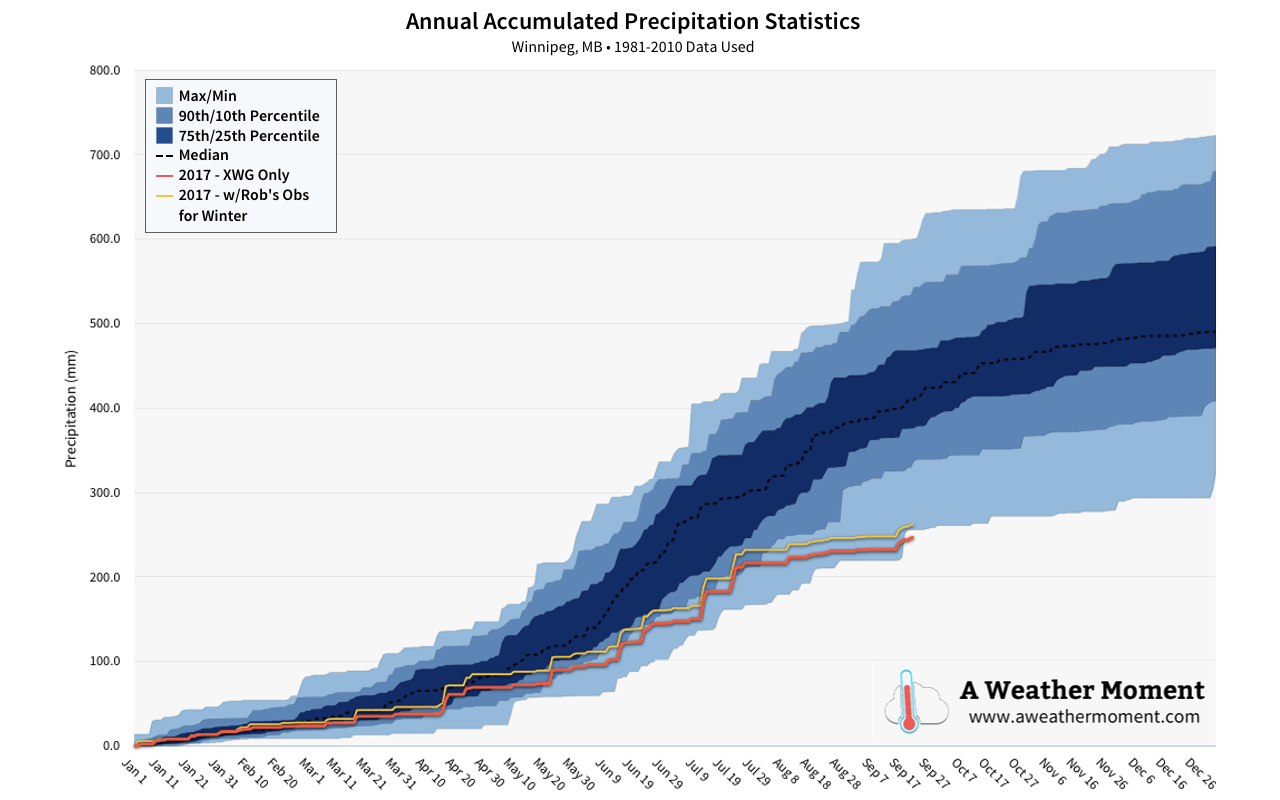
December 2017 brought Winnipeg’s rather dry 2017 to a close with more of the same. The airport climate observing site saw a paltry 7.5 mm of precipitation through the month, well below the climatological average of 20.6 mm.

The most significant precipitation event of the month occurred on the night of December 10th into the morning of December 11th when approximately 3-5 cm of snow fell, followed by some blowing snow. The airport received 2.8 mm of liquid equivalent from this event which was the single-largest event of the month. The second-largest precipitation event occurred on December 15/16, when light snow persisted for much of the two days. The airport received 2.1 mm of precipitation from this event. Lastly, the third notable precipitation event occurred on December 4th when freezing rain quickly gave way to snow for the remainder of the day. The city only received a couple of centimetres of snow with the airport reporting just 0.6 mm of liquid equivalent.

These three events combined to produce 73% of the month’s precipitation. The remainder was through numerous light to trace snowfall events. These events weren’t uncommon; there were another 9 days in December with measurable precipitation at the airport.

2017 Annual Precipitation Statistics – Updated January 10, 2018
Winnipeg ended the year with well-below typical precipitation based on the 1981-2010 statistics.
The Charleswood measuring site maintained by Rob’s Obs, similar to November, once again saw greater precipitation amounts.2 With precipitation reported on 16 of 31 days, Charleswood reported 16.5 cm of snow3 and 11.2 mm of total precipitation. The Charleswood site reported 40% more precipitation than the airport, but also fell well short of the climatological average of 20.6 mm.

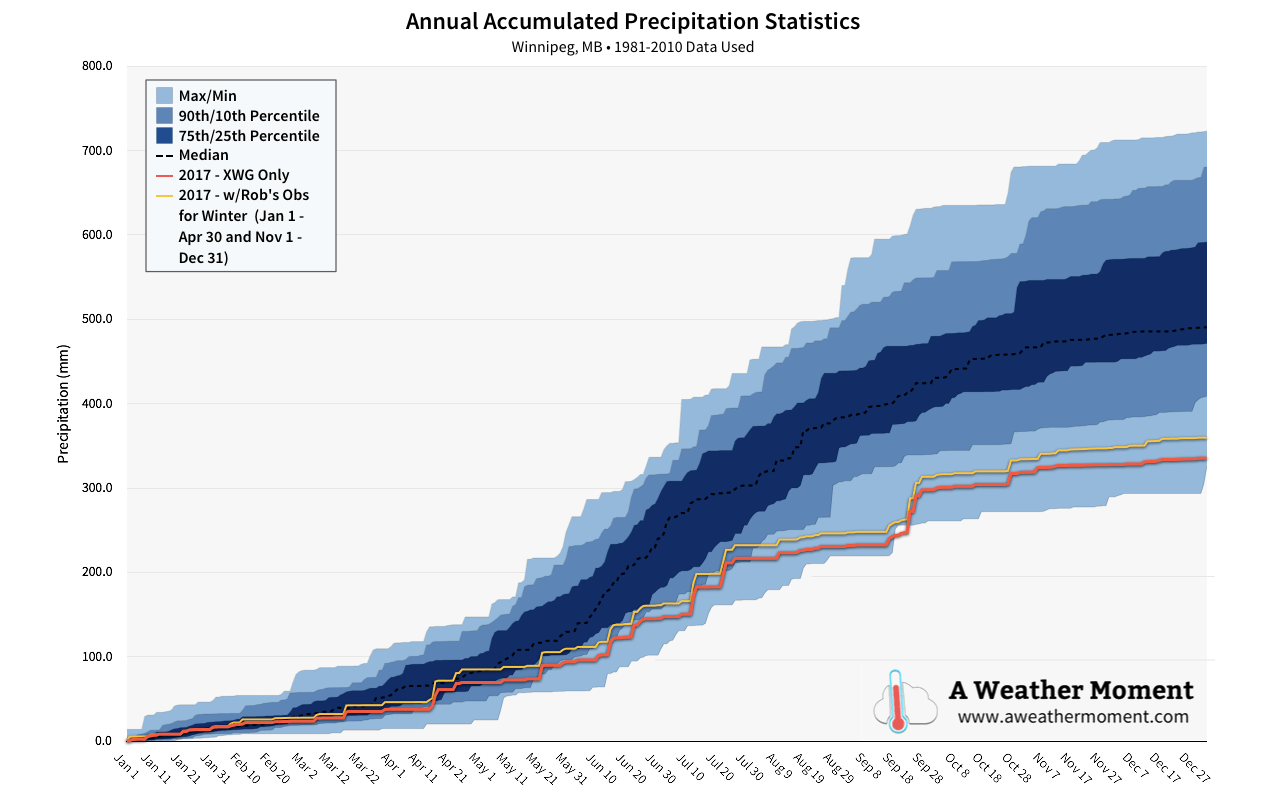
We’ll have more about the overall annual precipitation statistics in our 2017 climatological summary.

Forks Comparison

The urban heat island is a well documented weather phenomena, but we think it’s interesting to begin building a record of quantifying the variability of conditions between the middle of the city and the airport, both for interest’s sake as well as to better identify the difference in temperatures one may experience if they live closer to the core of the city versus nearer the perimeter.

As a general rule, we expect warmer conditions at the Forks, particularly at night, and no systematic difference in precipitation. The Forks is not considered the official climate record location for Winnipeg, so it will not be used for climatological rankings or comparisons.

Note: Due to technical problems, data for The Forks is unavailable for December 27th and 28th.

In December 2017, The Forks experienced higher daily mean temperatures on 28 of 29 days, warmer daytime highs on 22 of 29 days, and warmer overnight lows on 28 of 29 days. The monthly average high temperature was 0.5°C warmer at The Forks, the monthly average overnight low was 2.7°C warmer at The Forks, and the monthly mean temperature was 1.6°C warmer at The Forks.

The most noticeable temperature difference at The Forks occurred on December 19th where the Forks’ minimum temperature of -15.9°C was 6.8°C warmer than the airport’s -22.7°C.

The Forks ended the month with 0.9 mm more precipitation than the airport at 8.4 mm with all events within 1 mm of each other. This is still less than the Charleswood amounts by 2.8 mm, showing the shortcomings in utilizing automated systems to measure snowfall.


In the end, December was generally pleasant but had a bitterly cold finish. There were no major snowfall events and precipitation continued to be well below normal, rounding out a very dry year in Winnipeg.

Onwards to 2018!

  1. …or the 65th coldest, depending on how you’d like to look at it.
  2. This is expected; in addition to not providing accurate snowfall accumulation measurements, the automated sensors used at the ECCC climate sites tend to under-report precipitation as the gauges can under-catch snowfall when there is wind.
  3. For our purposes, a measure of trace snowfall is taken to equal 0.1 cm with 0.1mm of liquid equivalent.

Winnipeg’s November 2017 Kicked Off With Record Cold then Warmed, Remained Dry

November 2017 got off to an early cold snap as a storm passing through on the 4th brought around 10 cm of snow to Winnipeg and then plunged the city into record cold by the 9th. Winnipeg would then spend the rest of the month trending towards a milder pattern, but the early month cold snap wasn’t to be overcome and Winnipeg ended the month with a below-seasonal monthly mean temperature.

The most notable temperature event of November was the exceptional cold that moved through the region on the 9th. Winnipeg set both a new record daily minimum temperature and a tied the record daily low maximum temperature. The minimum temperature of -23.7°C broke the previous record of -20.6°C set in 1966, and the high temperature of -11.4°C tied the current coldest daily maximum temperature set in 1986.

November 9th was the coldest day of the month with a daily mean temperature of -17.6°C, a whopping 14.6°C below the seasonal daily mean of -3.0°C.

The highest daytime high came on November 23rd when temperatures reached a high of +5.2°C, but the warmest overall day came on the 30th when a milder overnight low and daytime high of +2.0°C resulted in a daily mean temperature of -0.7°C, a full 9.6°C above the seasonal daily mean temperature of -10.3°C.

November had a monthly mean temperature of -6.7°C, which was 1.4°C below the seasonal normal of -5.3°C. The mean daily high temperature was -1.8°C, which was 0.8°C colder than normal. The mean daily low temperature was -11.5°C, a full 2.0°C below normal. Colder than normal daytime highs occurred on 17 or 30 days and colder than normal overnight lows occurred on 17 of 30 days as well. 18 of 30 days resulted in colder than normal daily mean temperatures. Despite the single broken record, the month was relatively unremarkable overall, sitting in the bottom half of the pack as the 93rd warmest November on record[1].

Perhaps most notably, though, is the stark contrast from November 2016 which saw every single day of the month bring above-seasonal temperatures and ended up as the warmest November on record.

The monthly temperature range was 28.9°C, from a maximum temperature of 5.2°C on November 23rd to a minimum temperature of -23.7°C on November 9th.

The longest stretch of below-seasonal days was 12, from November 1st to November 12th. The longest stretch of above-seasonal daily mean temperatures was 5, from November 26th to November 30th.

Precipitation Notably Lacking

Precipitation was significantly lower than normal through much of November; 58% of the monthly precipitation occurred on November 4th when the airport received near 10 cm of snow that melted down to 5.3 mm of liquid.

November typically sees about 25 mm of precipitation, and 2017’s total of 9.2 mm falls well outside of normal. The top 3 days of precipitation – 5.3 mm on the 4th, 1.1 mm on the 10th, and 0.8 mm on the 11th – produced 78% of the month’s precipitation.

2017 Annual Precipitation Statistics – Updated December 4, 2017
Below-normal precipitation in November continues to put Winnipeg below the 10th percentile of 1981-2010 precipitation totals.

The story was slightly different at the Charleswood measuring site maintained by Rob’s Obs. The site saw a total of 21.3 cm of snow[2] and a total of 14.3 mm of liquid precipitation.[3] The Charleswood site had 43% more precipitation than the airport, but still fell well below normal with just 57% of the 1981-2010 monthly average.

Forks Comparison

One feature I’d like to add to these monthly overviews is a comparison with the official Environment Canada site at The Forks. The urban heat island is a well documented weather phenomena, but I thought it would be interesting to begin building a climatology of exactly how different conditions are in the middle of the city, both for interest’s sake as well as to better quantify the difference in temperatures one may experience if they live closer to the core of the city versus nearer the perimeter.

As a general rule, we expect warmer conditions at the Forks and no systematic difference in precipitation. The Forks is not considered the official climate record location for Winnipeg, so it will not be used for climatological rankings or comparisons.

So, for November 2017, The Forks experienced higher daily mean temperatures on 29 of 30 days, warmer daytime highs on 24 of 30 days, and warmer overnight lows on 29 of 30 days. The monthly average high temperature was 0.6°C warmer at The Forks, the monthly average overnight low was 2.4°C warmer at The Forks, and the monthly mean temperature was 1.5°C warmer at The Forks.

On the 5 days where the daytime high was colder at The Forks, it was by 0.5°C or less. On the 24 days the daytime high was warmer, it was by up to 1.7°C. A stark contrast was seen in overnight lows, which saw one night 0.2°C colder than the airport, but of the 29 warmer nights, it reached as much a 7.8°C warmer than the airport.[4]

The Forks ended the month with 0.2 mm more precipitation than the airport through a mix of events that brought more or less in comparison. The biggest difference was the major snowfall on November 4th in which The Forks received 8.5 mm compared to the airport’s 5.3 mm. This was also higher than the Charleswood observation site’s roughly 6.2mm from the event.


November 2017 ended up a cool, dry month. A milder second half moderated the extreme cold that followed the single major snowfall event of the month on November 4th, but overall monthly temperatures still ended up below the seasonal average. Precipitation was well below normal at both the Airport and Charleswood observation sites, continuing the trend of a rather dry year in Winnipeg.


  1. …or the 50th coldest on record.  ↩
  2. For our purposes, a measure of trace snowfall is taken to equal 0.1 cm with 0.1mm of liquid equivalent.  ↩
  3. Liquid precipitation is a combination of any rainfall and the liquid equivalent of the snowfall.  ↩
  4. This occurred on November 17th when The Forks saw a minimum temperature of -71.°C compared to the airport’s -14.9°C.  ↩

September Brought Mild Temperatures, Wet Weather

September brought mild weather to Winnipeg with above normal temperatures on about two-thirds of the days in the month. The month also started off extremely dry, but a change to a more unsettled pattern mid-way through the month ended up producing measurable rain on 9 of 13 days, including 25 mm of rain on September 22.

September is typically a month that brings a lot of cooling to the region; the daily mean temperature drops from 15.6°C at the start of the month to 9.3°C at the end of the month, a drop of 6.3°C. So while the average daytime high did drop considerably through the month in line with this trend, temperatures still remained generally above normal, with cool spells few and fair between. The warmest day of the month came on September 12, when Winnipeg set a new daily record high temperature of 34.8°C, beating the old record of 33.3°C set in 1952. That day was also the most “warmer than normal” day of the month with a daily mean temperature of 24.3°C, a full 11.3°C warmer than the normal daily mean of 13.0°C.

The coldest temperature of the month came on September 29th, where the temperature dipped to a chilly -1.2°C in the morning, 4.6°C below the normal seasonal low of 3.4°C.

September had a monthly mean temperature of 14.2°C, which was 1.9°C above the seasonal normal of 12.3°C. The mean daily high temperature was 20.1°C, which was 1.6°C above normal. Warmer than normal daily highs occurred on 20 out of 30 days. The mean daily low temperature was 8.2°C, which was 2.2°C above normal. Warmer than normal daily low temperatures occurred on 21 of 30 days.

The monthly temperature range was 36°C; from a maximum temperature of 34.8°C on September 12 to a minimum temperature of -1.2°C on September 29.

The longest stretch of above-seasonal days was 8, from September 7 to September 14. The longest stretch of below-seasonal daily mean temperatures was 3, which occurred on September 4-6, 15-17, and 24-26.

An Abrupt Mid-Month Change Brought Rainy Conditions

September begin with very dry conditions, continuing the trend from August, which saw dramatically lower than normal rainfall. Mid-month, however, a significant shift occurred which brought disturbance after disturbance across southern Manitoba, producing much rainier conditions.

As can be seen above, very little rain fell between September 1 to September 14, with just 1.8 mm over two rainfall events. Beginning September 15, however, came rain on 9 of 13 days, producing the wettest 10-day stretch of 2017. Between September 17-26, 61.5 mm of rain fell in Winnipeg, eclipsing the 60.8 mm of rain that fell between July 15-24. The largest rainfall event occurred on September 22, when 25.2 mm of rain fell. This was followed quickly by another 18.3 mm on September 24. These two events combined to make the highest 3-day rainfall total of 2017 as well at 43.5 mm, beating 32.2 mm between July 11-13 by 11.3 mm.

With a monthly total of 67.1 mm, Winnipeg exceeded the seasonal normal of 45.8 mm by 21.3 mm.

2017 Annual Precipitation Statistics – Updated October 1, 2017

By mid-September, Winnipeg had crept into having the driest year since 1980, however the rainfall through the second half of the month has eliminated that potential by raising our annual precipitation amounts above the driest on record. Winnipeg still remains well below-normal, outside 2 standard deviations from the 1981-2010 normal amounts.


All in all, September was a beautiful month. Exceptional warmth through the first half gave way to near-seasonal temperatures in the second half, but overnight lows that remained well above-normal through much of the month helped keep that fall chill away until near the very end. The rainfall through the second half of the moth helped alleviate some of the drought that the region has seen, although Winnipeg still sits in a significant precipitation deficit for the year.

October has continued September’s trend so far with most of the days bringing above-normal temperatures to the region. Precipitation has been sparse, though, and little is on the horizon. Although Winnipeg saw its first snowfall of the year on October 14, temperatures will rebound well above-normal with unseasonably warm temperatures expected to build into the region later this week. With daytime highs nearly 10°C above normal and mild overnight lows, it looks poised to offer one last stretch of summer-ish weather before jacket weather arrives for good.

August Brought Mild Days, Cool Nights, and Almost No Rain

August was an interesting month regarding temperatures, particularly because the overall trend was shaped largely by the distinct lack of humidity. The monthly mean temperature ended up slightly below seasonal, but that was driven by unseasonably cool overnight lows. In fact, the average overnight low for August 2017 was 2°C below the seasonal average. Contrast that with daytime highs that were actually warmer than normal; August 2017 ended with an average high slightly above the seasonal average.

Perhaps of note, humidity levels were quite low through the month of August. We don’t quite have the dew point climatology set up here at A Weather Moment, so I asked Winnipeg’s resident weather statistician how August 2017 ranked in terms of average dew point:

So August 2017 ended up the 16th least humid of the last 64 years. The reason cooler nights can be linked to the low levels of humidity come from a simple physics lesson many learn in high school: dry air heats up – and conversely cools down – more quickly than water. The drier conditions allowed temperatures to climb high, but also allowed it to cool off more significantly at night.1 As an aside, this is why many humid places have smaller temperature ranges from day to night, while the driest places on earth typically have huge temperature ranges between day and night.

Getting into the actual statistics, August 2017 ended with a mean temperatures of 17.7°C, -0.8°C below the seasonal average of 18.5°C. The average daytime high was 25.5°C, 0.5°C above the seasonal average of 25.0°C. The average overnight low ended up at 9.9°C, -2.0°C below the seasonal average of 11.9°C.

August wraps up Summer 20172, which ended up with a mean temperature of 17.8°C. That places it as the 87th warmest3 on record, and comes in -0.6°C cooler than the summer of 2016.

Rain, What Rain?

Another notable aspect of August 2017 was the distinct lack of rainfall. Typically Winnipeg will receive around 77 mm of rain through August, but this year the city received only 14.1 mm at the airport, a mere 18% of the normal monthly rainfall.

August was just another month in the story of summer 2017: it was dry. The summer season accumulated 136.7 mm of rain at the airport, which was just 56% of the seasonal normal of 244 mm.

2017 Annual Precipitation Statistics – Updated September 20, 2017
Winnipeg is currently experiencing one of the driest years since 1981.

The drier pattern began in May, and then has not relented. While other areas in the Red River Valley are not quite in as dry a spell as Winnipeg, a general trend of dryness has persisted across much of the region.

August 2017 had measurable precipitation on just 6 of 30 days, with the single largest one-day rainfall total of 6.7 mm on Wednesday August 9th.


August 2017 was actually quite a pleasant month in many ways: most days brought a pleasant and dry summer warmth while evenings were cool. The month brought plenty of sunshine with rain being an elusive sight, continuing the dry trend that began in May of this year.

September has been quite a different month so far, with significant warmth in place this month. Winnipeg hit the warmest day of 2017 on September 12th when temperatures climbed to a record-setting high of 34.8°C. Daytime highs and overnight lows have largely been above-normal much of the month. While rain was sparse at the beginning of the month, the latter half has so far shifted into a more unsettled pattern, bringing relatively frequent rainfalls to the region, although Winnipeg has managed to elude much of the activity.

  1. I also asked Julien to calculate the correlation between humidity levels and highs and lows. Daily low temperatures had an r value of 0.61, showing a much stronger correlation than daytime highs which had an r value of 0.28.
  2. Meteorological summer runs through June, July, and August.
  3. …or 59th coldest, depending how you prefer to look at it.