Scientists don’t know much about the mysterious, powerful electric discharges that sometimes occur in the upper levels of the atmosphere in conjunction with thunderstorms. The first photograph of the phenomenon—which can occur as high as about 90km above the surface of the Earth and are known variously as sprites, pixies, elves, or jets—was only taken from Earth in 1989.
Fortunately for scientists interested in these storms, the International Space Station offers an excellent vantage point at an altitude of about 400km. So Danish researchers devised a “Thor experiment”—named after the hammer-wielding Norse god—to study the phenomenon. As part of the experiment, an astronaut on board the station would image thunderstorms under certain conditions, and these observations would be correlated with data collected by satellites and ground-based radar and lightning detection systems.
It has been interesting seeing more and more proper research going into these upward-directed electric discharges from thunderstorms. I recall just in the early 2000’s stories about pilots who had seen these phenomenon but didn’t share their experiences because they felt people may not believe them.
Now we know not only that these blue flashes exist, among other upper-atmosphere related phenomenon, but also that thunderstorms may have a role in troposphere-stratosphere gas exchange.
Interesting stuff. Follow through the link for more photos; the published paper with findings is available here.1
Chanrion, O., T. Neubert, A. Mogensen, Y. Yair, M. Stendel, R. Singh, and D. Siingh (2017), Profuse activity of blue electrical discharges at the tops of thunderstorms, Geophys. Res. Lett., 44, 496–503, doi:10.1002/2016GL071311. ↩
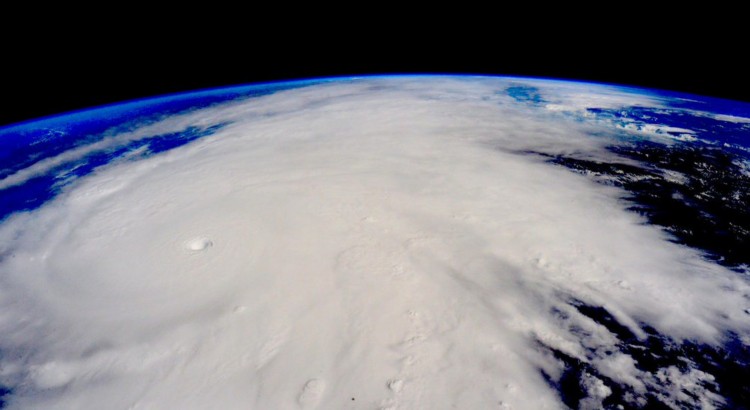
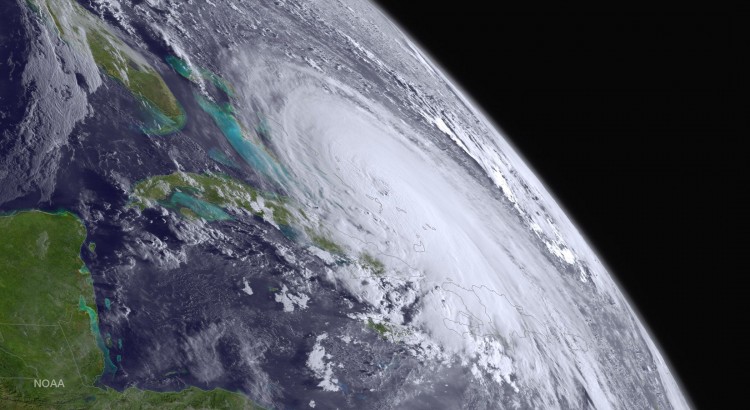
On the 20th of October a tropical depression formed in the Eastern Pacific, well south of Mexico and began drifting slowly northwest into an area of warm sea surface temperatures (SST’s) of about 30°C with low shear.
Typically hurricanes of this strength are not seen this late in the Eastern Pacific, but very warm SST’s were still present in the area – perhaps influenced by the strong El Niño that is ongoing, provided the fuel necessary for a hurricane of this strength. After drifting northwest without significant intensification early in the week, Thursday is when Patricia began intensifying as it produced a large burst of convection. Patricia intensified to a rate the Western Hemisphere had not seen before – it dropped an incredible 100mb within 24 hours, and at the same time Patricia reached category five status which is the highest category on the Saffir-Simpson scale.
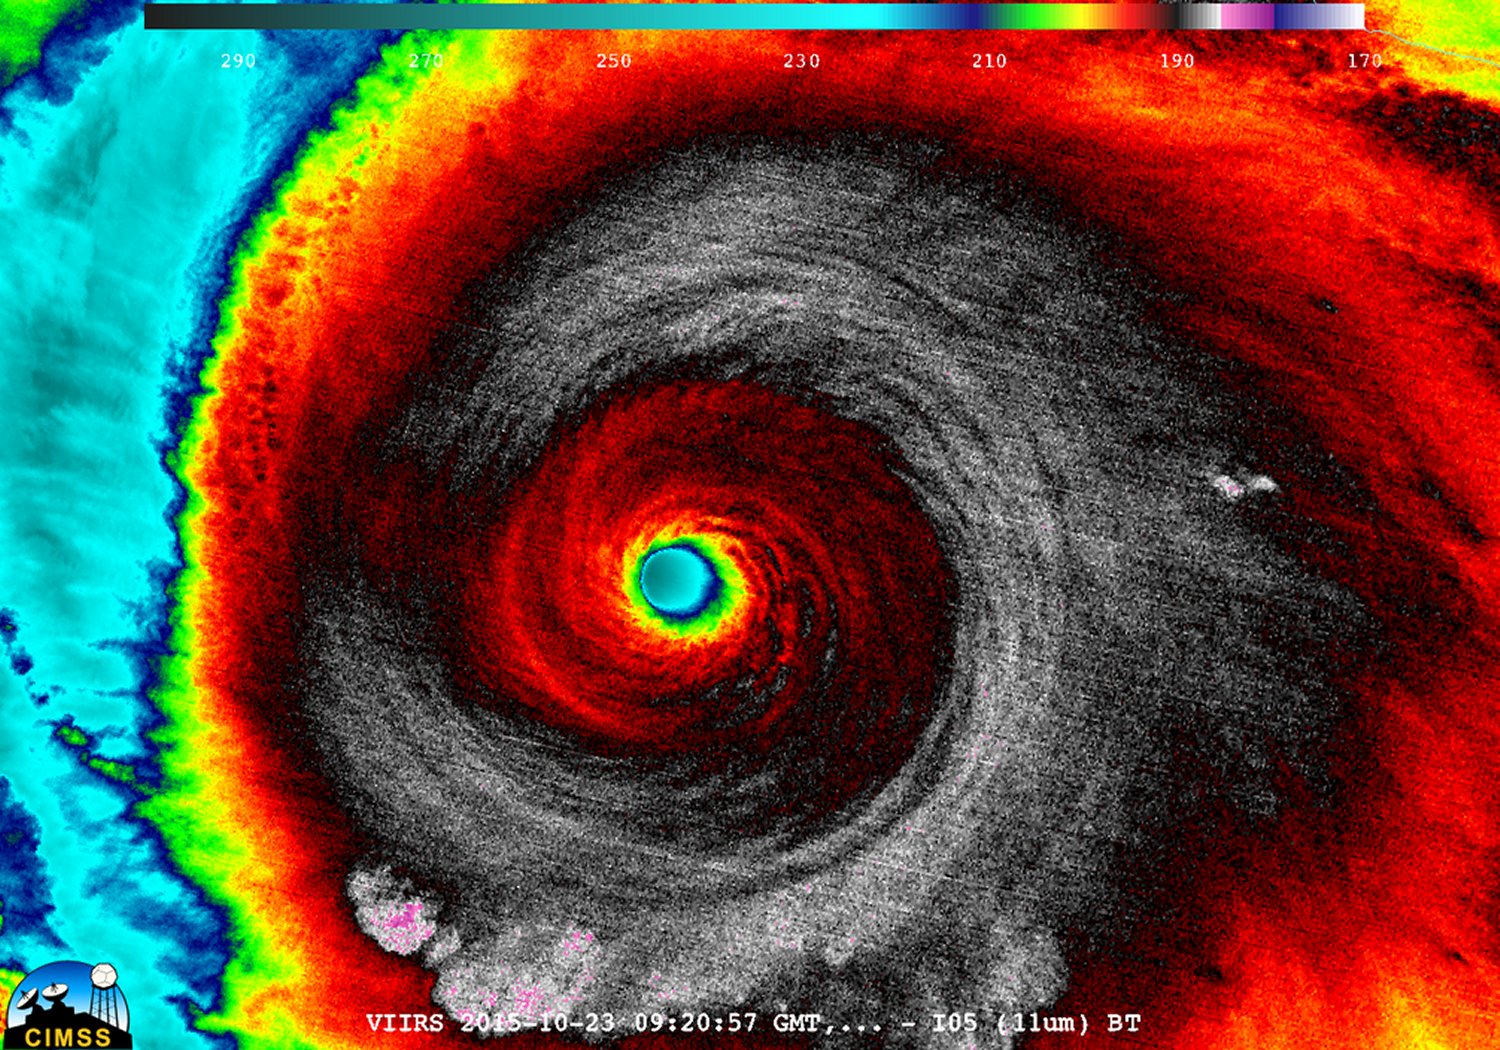
Enhanced IR image of Patricia early Friday morning. (Source: CIMSS)
As it neared its peak early Friday morning, the hurricane hunters flew through the hurricane to sample the environment. The data collected was astonishing; a drop sonde had measured a surface pressure of 883mb with a 45kt surface wind. From this they extrapolated that the central pressure of Patricia was about 879mb at the time of the drop sonde, breaking another Western Hemisphere record for lowest pressure observed. Winds also peaked in Patricia around the same time, where sustained winds were 325km/h, with possible gusts up to 400km/h. Thankfully Patricia’s wind field did not extend very far from its core because it was a fairly compact inner core with pinhole eye – hurricane force winds only extended about 40km from the centre of the storm.
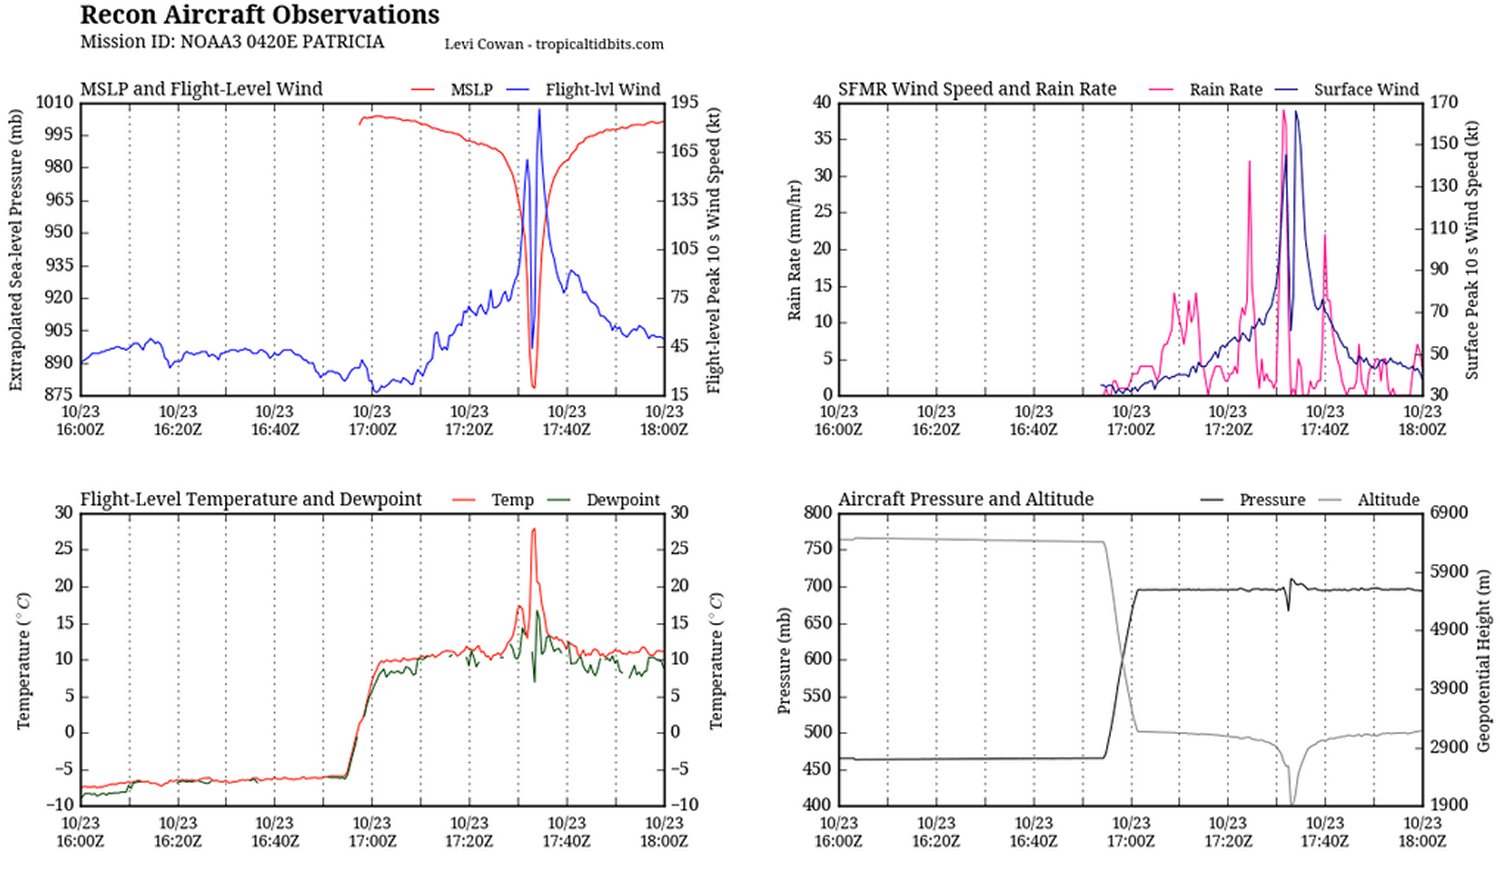
Aircraft data collected Friday morning from the Hurricane Hunters. To note is the top left graph which measured a very low extrapolated MSLP as well as the extremely high winds at aircraft level. In the bottom left graph it’s also to note the steep rise in temperature (of about 15C in the eye – the result of subsiding air warming. (Source: @tropicaltidbits)
What’s it like flying into one of the strongest ever observed? Here’s a video of the Hurricane Hunters flying in Patricia:
Patricia made landfall as a category five hurricane southeast of Puerto Vallarta, near Cuixmala on Friday evening. Thankfully no deaths had been reported yet out of Mexico as of this morning but significant damage occurred along the coast near La Manzanilla which was both a result of storm surge and the strong winds. After encountering land and terrain Patricia’s inner core quickly collapsed and the system’s biggest threat has now shifted to heavy rainfall. Patricia’s moisture plume is expected to move northeast, helped by an upper level trough, across the Sierra Madres and into southeast Texas. A dangerous flash flooding event is ongoing this weekend in Texas with all the tropical moisture combined with a source of lift present.
Over last weekend and the beginning of this week a dangerous flooding situation set up over most of South Carolina.
[map type=”satellite” autofit=”1″ disable_scrollwheel=”1″]
[pin]Gills Creek, South Carolina[/pin]
[pin]Millwood, South Carolina[/pin]
[pin]Kingstree, South Carolina[/pin]
[pin]Sumter, South Carolina[/pin]
[pin]Columbia, South Carolina[/pin]
[/map]
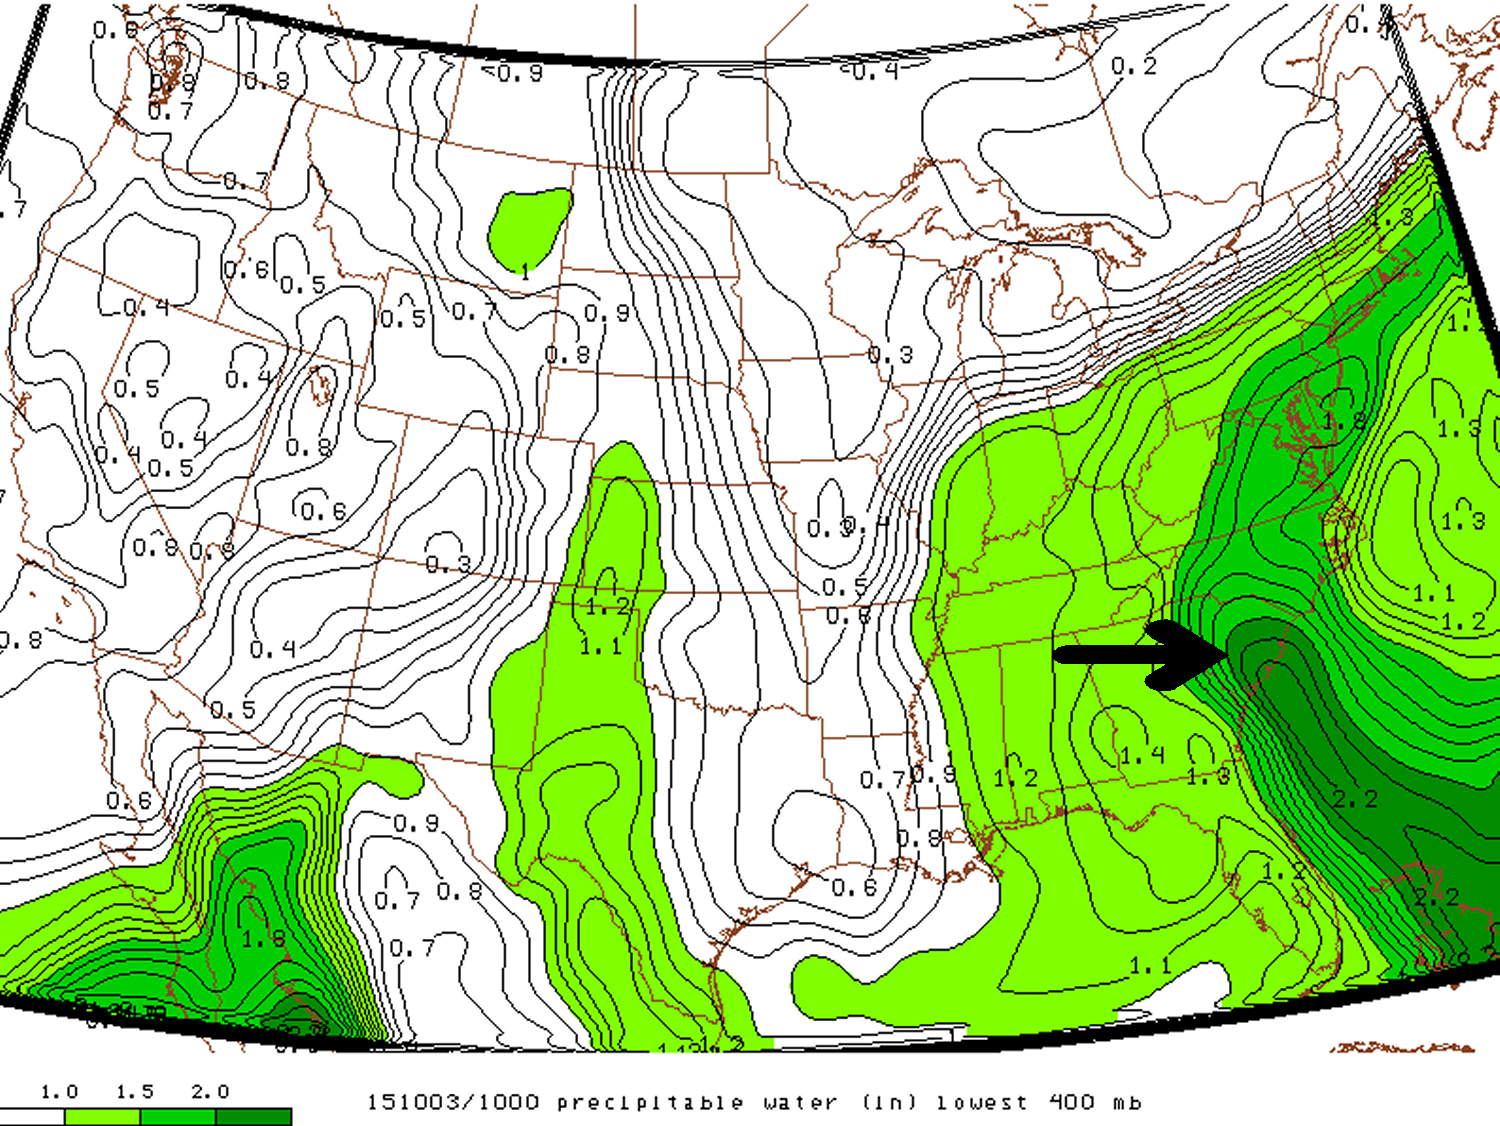
An upper level low which was in place across the southeast CONUS of the United States slowly drifted eastward, but at the same time drew in a tongue tropical moisture into South Carolina where PWATs exceeded 50mm. With much dynamic lift in place provided by the slow moving upper level low, rainfall, which at times very heavy, persisted between October 2nd and the 5th. By the 6th most of the rainfall had finally dissipated and the disturbance had moved out to sea.
A tongue of precipitable water over South Carolina exceeding 50mm Saturday last weekend.
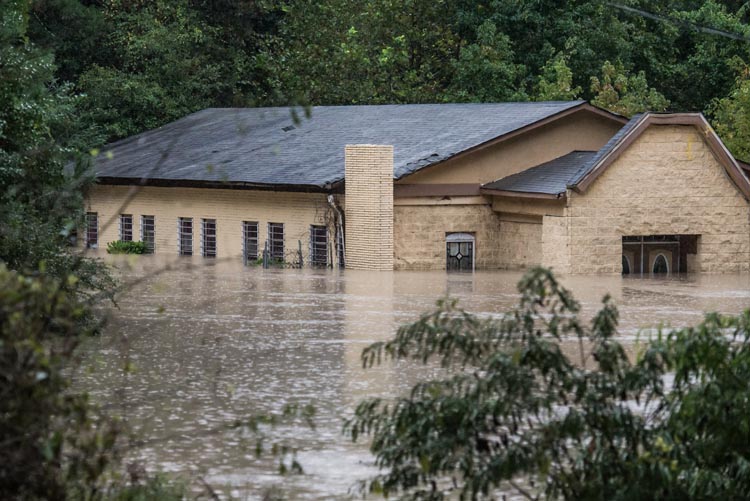
The hardest hit areas comprised of an area along the South Carolina coast extending inland around Charleston and northwest from there. Here, it was common to see storm amounts exceed 500mm. This event broke numerous all time (one, two and three day) rainfall total records including in South Carolina’s capital Columbia which recorded 291mm from the event and a one day, all time, record of 175mm. With all things considered this was a historical event for South Carolina. Unfortunately widespread flash flooding occurred with this heavy rainfall and 17 people perished, it is also expected that this natural disaster will top $1 billion dollars in damages.
Church underwater in South Carolina. (Souce: Sean Rayford via Jeff Master’s blog)
Here are a few more notable amounts from the event (data from NWS):
Gills Creek, SC storm total of 546mm
Seven stations with over 50 years of data had their wettest October on record, only one week into the month (via weather.com)
Millwood, SC storm total 527mm
Kingstree, SC 24-hour total of 399mm, possibly beating the all-time South Carolina 24 hour precipitation record of 376mm from 1999 during Hurricane Floyd (via weather.com).
Sumter, SC storm total of 528mm
This weekend more soggy weather is in place for South Carolina and flood warnings/flash flood watches have already been issued by the NWS. Not as much rain is expected from this system as it is faster moving and PWATs are not quite as high as seen last week. The one bit of good news that has come out of this flooding is that all moderate drought that was in place has been wiped away from the state.
Welcome to Weather News This Week, a new feature here on A Weather Moment that will alternate with our existing Elsewhere in Weather News feature. Expect to find a collection of interesting links to writings elsewhere that cover weather events and news as well as advances in the science of meteorology. Let’s get right to it!
Arstechnica took a look at how the language used by climate scientists when talking about climate change differs dramatically from those who oppose them:
[…] language itself is not an indication of the strength of the evidence; it can really only tell us how people are using that evidence to make an argument, and whether they’re doing so tentatively or forcefully. So, looking at how two opposing sides of a scientific argument use language to make their case can tell us something about their thinking.
It can be especially interesting to look at the use of tentative and forceful language in the case of climate change, where the language can be inflammatory. Scientists who describe the likely future path of our habitat often face the accusation of “alarmism.”
Srdan Medimorec and Gordon Pennycook, two graduate school researchers at the University of Waterloo, are interested in how people form beliefs on the basis of argument. They decided to look into the writing of opposing groups—climate scientists and people who refuse to accept the evidence on climate change—to see whether there was a consistent difference in language use.
Over on the Boston Globe, they have a fantastic gallery of images of the historic flooding that occurred in South Carolina.
Flooding around Aberdeen Country Club, on Oct. 6 in Longs. S.C.. (Janet Blackmon Morgan/The Sun News via AP)
The flooding in South Carolina was some of the worst on record and was a result of a quasi-stationary upper-level low anchored over the southeastern U.S. that was able to tap into moisture from Hurricane Joquain. The result was a band of torrential rain and thunderstorms that remained in place for several days, resulting in absolutely smashed rainfall records for many locations which saw more than 20 in (500+ mm) of rain.
On Wednesday, September 30, less than six days from a potential landfall, the ECMWF operational model was consistently keeping Joaquin offshore, even as the GFS and nearly all other models were bringing the hurricane into the U.S. East Coast. From late Wednesday into Thursday, the GFS and other models began to shift toward an offshore track for Joaquin, as the hurricane itself was still diving southwestward into the Bahamas. By Friday, there was virtually unanimous model agreement on the offshore track that proved accurate.
“People are turning to me less and less for what to wear to work and more for an explanation on the more intense and more frequent weather anomalies,” said Wagstaffe, an on-camera meteorologist for the CBC, Canada’s public broadcaster.
“The audience is getting more hungry for knowledge about what’s happening with the weather, and why. The story about climate change is becoming more interesting and what it will mean for our future.”
How Wagstaffe does her job has also changed. There’s more and better satellite and information technology to work with, but the so-called “normal” weather patterns that acted as benchmark have been out of whack in recent years. That includes this summer, when some of the models used to look at the longer-term forecast had to be ignored because of the hot and dry summer in Western Canada and the soggy and cool conditions in Central and Eastern Canada.
Over on the Winnipeg Weather blog, Julien has compiled a few statistics for Summer 2015 in Winnipeg. The whole thing is worth a read, but he especially made some interesting observations about summer humidity in Winnipeg:
In the last 20 years, 9 years saw a top 10 most humid summer since 1953. Summers have become increasingly humid since the 1990’s and this is easily seen in the graph below. The graph shows the top 20 most and least humid summers (red and blue dots) and the 30-year running mean (green line). Whether or not the increasing humidity is a trend that will continue is unknown. With only 63 years of dewpoint records, there simply isn’t enough data to see if there were similar humid periods in the past.
Graph showing a trend of increasingly humid summers in Winnipeg. 1980’s normal summer average dewpoint was about 11.5°C. Today’s normal is now close to 12.8°C.
July and August were particularly humid. With an average dewpoint of 16.1°C in July, it was the second most humid July and month on record since 1953. Only July 2012 was more humid with an average dewpoint of 16.5°C. August tied with 2003 for 14th most humid with an average dewpoint of 13.7°C.
That’s it for this week; we’ll be back in a fortnight with more weather-related reading for you! If you like the idea of this and have any suggestions for format or content, leave us a comment below!