Welcome to Weather News This Week, a new feature here on A Weather Moment that will alternate with our existing Elsewhere in Weather News feature. Expect to find a collection of interesting links to writings elsewhere that cover weather events and news as well as advances in the science of meteorology. Let’s get right to it!
Arstechnica took a look at how the language used by climate scientists when talking about climate change differs dramatically from those who oppose them:
[…] language itself is not an indication of the strength of the evidence; it can really only tell us how people are using that evidence to make an argument, and whether they’re doing so tentatively or forcefully. So, looking at how two opposing sides of a scientific argument use language to make their case can tell us something about their thinking.
It can be especially interesting to look at the use of tentative and forceful language in the case of climate change, where the language can be inflammatory. Scientists who describe the likely future path of our habitat often face the accusation of “alarmism.”
Srdan Medimorec and Gordon Pennycook, two graduate school researchers at the University of Waterloo, are interested in how people form beliefs on the basis of argument. They decided to look into the writing of opposing groups—climate scientists and people who refuse to accept the evidence on climate change—to see whether there was a consistent difference in language use.
Over on the Boston Globe, they have a fantastic gallery of images of the historic flooding that occurred in South Carolina.
Flooding around Aberdeen Country Club, on Oct. 6 in Longs. S.C.. (Janet Blackmon Morgan/The Sun News via AP)
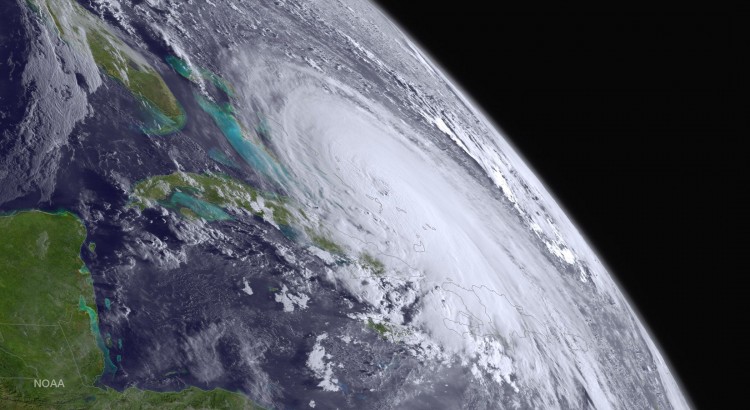
The flooding in South Carolina was some of the worst on record and was a result of a quasi-stationary upper-level low anchored over the southeastern U.S. that was able to tap into moisture from Hurricane Joquain. The result was a band of torrential rain and thunderstorms that remained in place for several days, resulting in absolutely smashed rainfall records for many locations which saw more than 20 in (500+ mm) of rain.
On Wednesday, September 30, less than six days from a potential landfall, the ECMWF operational model was consistently keeping Joaquin offshore, even as the GFS and nearly all other models were bringing the hurricane into the U.S. East Coast. From late Wednesday into Thursday, the GFS and other models began to shift toward an offshore track for Joaquin, as the hurricane itself was still diving southwestward into the Bahamas. By Friday, there was virtually unanimous model agreement on the offshore track that proved accurate.
“People are turning to me less and less for what to wear to work and more for an explanation on the more intense and more frequent weather anomalies,” said Wagstaffe, an on-camera meteorologist for the CBC, Canada’s public broadcaster.
“The audience is getting more hungry for knowledge about what’s happening with the weather, and why. The story about climate change is becoming more interesting and what it will mean for our future.”
How Wagstaffe does her job has also changed. There’s more and better satellite and information technology to work with, but the so-called “normal” weather patterns that acted as benchmark have been out of whack in recent years. That includes this summer, when some of the models used to look at the longer-term forecast had to be ignored because of the hot and dry summer in Western Canada and the soggy and cool conditions in Central and Eastern Canada.
Over on the Winnipeg Weather blog, Julien has compiled a few statistics for Summer 2015 in Winnipeg. The whole thing is worth a read, but he especially made some interesting observations about summer humidity in Winnipeg:
In the last 20 years, 9 years saw a top 10 most humid summer since 1953. Summers have become increasingly humid since the 1990’s and this is easily seen in the graph below. The graph shows the top 20 most and least humid summers (red and blue dots) and the 30-year running mean (green line). Whether or not the increasing humidity is a trend that will continue is unknown. With only 63 years of dewpoint records, there simply isn’t enough data to see if there were similar humid periods in the past.
Graph showing a trend of increasingly humid summers in Winnipeg. 1980’s normal summer average dewpoint was about 11.5°C. Today’s normal is now close to 12.8°C.
July and August were particularly humid. With an average dewpoint of 16.1°C in July, it was the second most humid July and month on record since 1953. Only July 2012 was more humid with an average dewpoint of 16.5°C. August tied with 2003 for 14th most humid with an average dewpoint of 13.7°C.
That’s it for this week; we’ll be back in a fortnight with more weather-related reading for you! If you like the idea of this and have any suggestions for format or content, leave us a comment below!