November 2017 got off to an early cold snap as a storm passing through on the 4th brought around 10 cm of snow to Winnipeg and then plunged the city into record cold by the 9th. Winnipeg would then spend the rest of the month trending towards a milder pattern, but the early month cold snap wasn’t to be overcome and Winnipeg ended the month with a below-seasonal monthly mean temperature.
The most notable temperature event of November was the exceptional cold that moved through the region on the 9th. Winnipeg set both a new record daily minimum temperature and a tied the record daily low maximum temperature. The minimum temperature of -23.7°C broke the previous record of -20.6°C set in 1966, and the high temperature of -11.4°C tied the current coldest daily maximum temperature set in 1986.
November 9th was the coldest day of the month with a daily mean temperature of -17.6°C, a whopping 14.6°C below the seasonal daily mean of -3.0°C.
The highest daytime high came on November 23rd when temperatures reached a high of +5.2°C, but the warmest overall day came on the 30th when a milder overnight low and daytime high of +2.0°C resulted in a daily mean temperature of -0.7°C, a full 9.6°C above the seasonal daily mean temperature of -10.3°C.
November had a monthly mean temperature of -6.7°C, which was 1.4°C below the seasonal normal of -5.3°C. The mean daily high temperature was -1.8°C, which was 0.8°C colder than normal. The mean daily low temperature was -11.5°C, a full 2.0°C below normal. Colder than normal daytime highs occurred on 17 or 30 days and colder than normal overnight lows occurred on 17 of 30 days as well. 18 of 30 days resulted in colder than normal daily mean temperatures. Despite the single broken record, the month was relatively unremarkable overall, sitting in the bottom half of the pack as the 93rd warmest November on record[1].
Perhaps most notably, though, is the stark contrast from November 2016 which saw every single day of the month bring above-seasonal temperatures and ended up as the warmest November on record.
The monthly temperature range was 28.9°C, from a maximum temperature of 5.2°C on November 23rd to a minimum temperature of -23.7°C on November 9th.
The longest stretch of below-seasonal days was 12, from November 1st to November 12th. The longest stretch of above-seasonal daily mean temperatures was 5, from November 26th to November 30th.
Precipitation Notably Lacking
Precipitation was significantly lower than normal through much of November; 58% of the monthly precipitation occurred on November 4th when the airport received near 10 cm of snow that melted down to 5.3 mm of liquid.
November typically sees about 25 mm of precipitation, and 2017’s total of 9.2 mm falls well outside of normal. The top 3 days of precipitation – 5.3 mm on the 4th, 1.1 mm on the 10th, and 0.8 mm on the 11th – produced 78% of the month’s precipitation.
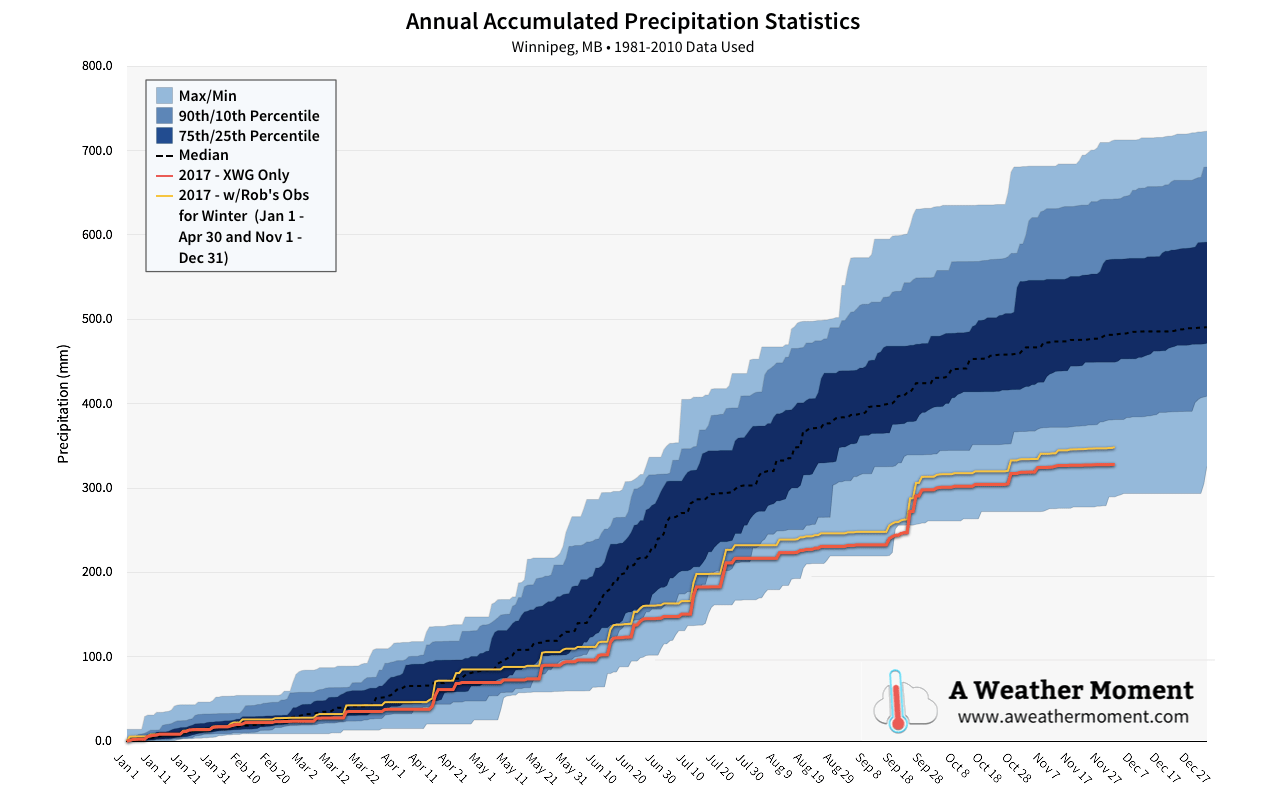
The story was slightly different at the Charleswood measuring site maintained by Rob’s Obs. The site saw a total of 21.3 cm of snow[2] and a total of 14.3 mm of liquid precipitation.[3] The Charleswood site had 43% more precipitation than the airport, but still fell well below normal with just 57% of the 1981-2010 monthly average.
Forks Comparison
One feature I’d like to add to these monthly overviews is a comparison with the official Environment Canada site at The Forks. The urban heat island is a well documented weather phenomena, but I thought it would be interesting to begin building a climatology of exactly how different conditions are in the middle of the city, both for interest’s sake as well as to better quantify the difference in temperatures one may experience if they live closer to the core of the city versus nearer the perimeter.
As a general rule, we expect warmer conditions at the Forks and no systematic difference in precipitation. The Forks is not considered the official climate record location for Winnipeg, so it will not be used for climatological rankings or comparisons.
So, for November 2017, The Forks experienced higher daily mean temperatures on 29 of 30 days, warmer daytime highs on 24 of 30 days, and warmer overnight lows on 29 of 30 days. The monthly average high temperature was 0.6°C warmer at The Forks, the monthly average overnight low was 2.4°C warmer at The Forks, and the monthly mean temperature was 1.5°C warmer at The Forks.
On the 5 days where the daytime high was colder at The Forks, it was by 0.5°C or less. On the 24 days the daytime high was warmer, it was by up to 1.7°C. A stark contrast was seen in overnight lows, which saw one night 0.2°C colder than the airport, but of the 29 warmer nights, it reached as much a 7.8°C warmer than the airport.[4]
The Forks ended the month with 0.2 mm more precipitation than the airport through a mix of events that brought more or less in comparison. The biggest difference was the major snowfall on November 4th in which The Forks received 8.5 mm compared to the airport’s 5.3 mm. This was also higher than the Charleswood observation site’s roughly 6.2mm from the event.
November 2017 ended up a cool, dry month. A milder second half moderated the extreme cold that followed the single major snowfall event of the month on November 4th, but overall monthly temperatures still ended up below the seasonal average. Precipitation was well below normal at both the Airport and Charleswood observation sites, continuing the trend of a rather dry year in Winnipeg.
- …or the 50th coldest on record. ↩
- For our purposes, a measure of trace snowfall is taken to equal 0.1 cm with 0.1mm of liquid equivalent. ↩
- Liquid precipitation is a combination of any rainfall and the liquid equivalent of the snowfall. ↩
- This occurred on November 17th when The Forks saw a minimum temperature of -71.°C compared to the airport’s -14.9°C. ↩