A textbook frontal passage is in store for the Red River Valley over the next few days as an incoming warm front brings a chance of flurries and another mild day before the cold front slumps through the region at week’s end, bringing another windy chance for snow.
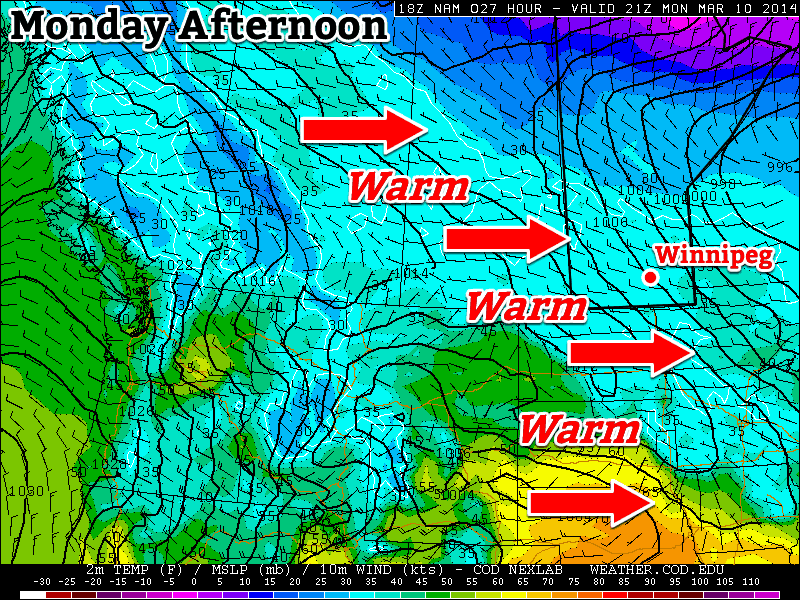
We’re off to a cold start this morning, but temperatures will soar today as a strong warm front pushes across the Red River Valley. Southerly winds will pick up through the day to around 30-40km/h by mid-afternoon. There will be a chance of flurries beginning midday and lasting through the early evening. No significant accumulations are expected and thanks the warming temperatures and recent melting, blowing snow should be minimal. Temperatures will climb to around -10°C by evening but continue rising through the overnight period to nearly -2°C by Thursday morning.

Thursday will be another beautiful day very reminiscent of Monday this week. Winnipeg will see relatively light winds and mixed skies as the temperature climbs all the way to 4°C. Similar to Monday, there will probably be significant variation across the city with some places climbing several degrees higher to 7-8°C.
Things will take a less pleasant turn on Thursday night when a cold front slices through Southern Manitoba. Gusty winds out of the northwest to 40km/h will accompany some flurry activity that will spread into the Red River Valley from north to south through the mid-to-late evening hours. The wind and any straggling flurries should taper off early Friday morning.
Friday sees an Arctic ridge of high pressure building into Manitoba bringing cooler temperatures with it. In Winnipeg, temperatures will be some 10°C cooler than Thursday with a daytime high only near -7 or -6°C under mainly sunny skies.. Winds will remain light and the temperature will drop close to -20°C on Friday night.
Cool Weekend Ahead
Temperatures will remain well below normal through the weekend in the Red River Valley. Saturday’s high looks to be near -15°C under mainly sunny skies while Sunday sees the coldest axis of air shifting off to the east, allowing temperatures to climb to the low minus single digits with a few cloudy periods.
In the southwest corner of the province, flurries will be possible numerous times over the next 5 days as the main frontal zone sets up across the region and weak disturbances ripple along it.