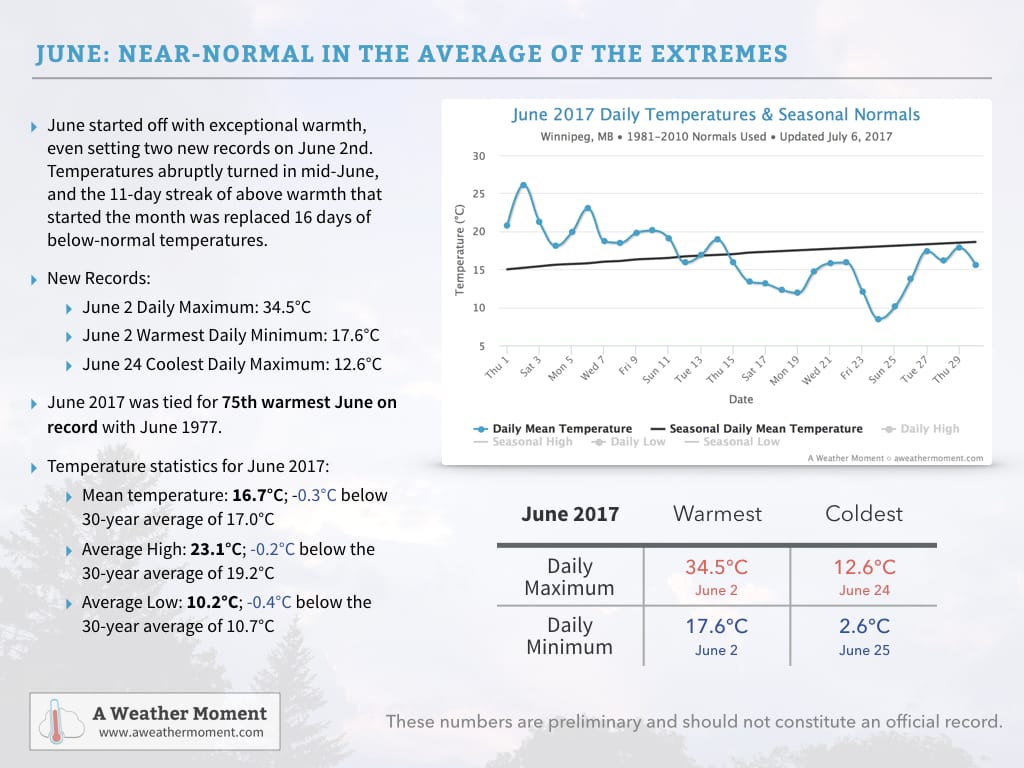
June 2017 started off with exceptional warmth as daily mean temperatures1 climbed 5-10°C above normal, a sharp break from a cool end to the month of May. Temperatures peaked on June 2nd when two new records were set in Winnipeg:
- Record daily maximum of 34.5°C, breaking the old record of 32.2°C set on June 2, 1948.
- Record warm daily minimum of 17.6°C, breaking the old record of 17.5°C set in June 2, 1988.
The warmth continued with above-seasonal temperatures gradually trending towards seasonal values by mid-June.
A significant pattern shift occurred on June 15th, shifting Winnipeg into a prolonged period of below-normal temperatures that would end up lasting the remainder of the month. Temperatures bottomed out on June 24th when Winnipeg set a new record:
- Record cold daily maximum temperature of 12.6°C, breaking the old record of 13.9°C set in 2004.
Temperatures then moderated to near-normal for the last few days of the month.
From record-setting warmth at the beginning of the month to record-setting cold at the end of the month, June 2017 averaged out to near-normal with a monthly mean temperature of 16.7°C, which was just -0.3°C below the normal monthly mean of 17.0°C. Perhaps a notable example of how the mean can be misleading.
In other temperature statistics:
- June 2017’s average high temperature was 23.1°C, just -0.2°C below the 30-year average of 19.2°C.
- June 2017’s average low was 10.2°C, -0.4°C below the 30-year average of 10.7°C.
Perhaps Not As Wet As You Think
Many people think of rain when they think of June, and it certainly had its fair share of precipitation with accumulating rainfall measured on 14 of 30 days, largely clustered between June 9th and 25th where there was measurable rainfall on 12 of 17 days.
While it rained frequently, total rainfall was actually below normal. The Winnipeg airport measured a total of 51.5 mm of rain through June 2017, well below the normal of 90.0 mm. So despite seeing many damp days, Winnipeg ended up with only 57% of the normal rainfall for the month.
So in the end, June 2017 was not quite what it seemed. Despite a mean monthly temperature near-normal, it was actually a month that progressed from record warmth in the first half to record cold in the second half. Despite raining almost half the days of the month, it ended up with just over half of the normal rain accumulation.
July is off to a much more consistent start with seasonal to slightly above seasonal temperatures and dry conditions. We’ll be keeping track of how the rest of the month progresses!
With regard to climatological normals in this post, we are using the 1981-2010 Climatological Normals for the Winnipeg International Airport.
- The daily mean temperature is the average of the daily maximum temperature and daily minimum temperature. ↩