2015 brought a huge assortment of wild weather to Southern Manitoba. From torrential rains, damaging wind storms, tornadoes, and above-normal temperatures to snow storms, there wasn’t much waiting between significant weather events. Here’s our top 10 weather stories of 2015!
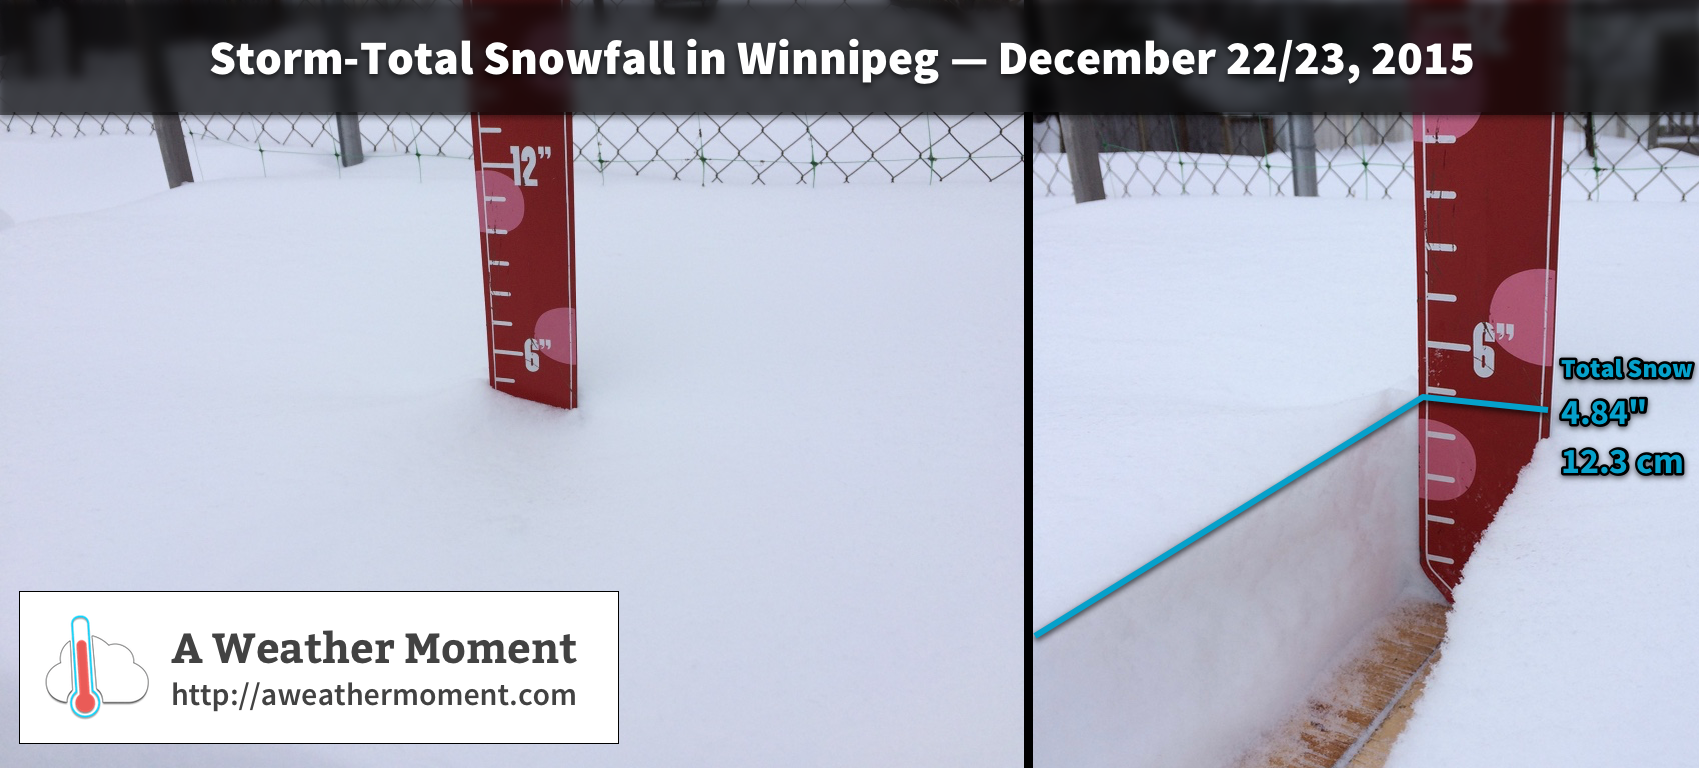
#10 – Parade of Snowstorms Just Before Christmas
Three snowstorms dumped a total of 40 cm of snow from December 16th to 23rd in Winnipeg.
The biggest snowstorm occurred on the 16th and 17th, dumping 20 cm. Strong winds helped carve drifts up to two-feet deep in some spots. 18 cm fell on December 16th alone at the official Charleswood station, breaking the old record of 8.4 cm in 1942 for the day.
With all the snow in mid December, travel was dramatically impacted. Residential streets were difficult to navigate and numerous vehicles were reported stuck in the snow. Thanks to the snowfall, snow depth in Winnipeg sat at 30 cm on Christmas morning; this was the deepest snow pack on Christmas Day in 15 years (since a 30 cm depth in 2000). In total, 44.0 cm of snow fell in Winnipeg in December, 83% above normal and the 12th snowiest December on record since 1872.
#9 – Dry Winter and Warm January
After a frigid start to January, a warm spell blessed southern Manitoba with above normal temperatures. A 17-day streak of above normal temperatures occurred from January 14 to 30. During this period, daily highs averaged -1.9°C and daily lows averaged -12.1°C, about 10°C warmer than normal. 6 days in the period exceeded the freezing mark and 6 days never saw temperatures dip below -10°C. The warmest days were January 22 and 23 when temperatures soared to 3.7°C and 3.1°C at the airport respectively. It was warmer inside the city with highs between 4 and 6°C. Some parts of southern Manitoba never even dipped below freezing on January 23. The extended warm spell melted what little snow was on the ground. By January 31, snow depth in Winnipeg was 12 cm, the 12th thinnest on record for the day since 1941. Gloomy skies and freezing drizzle were also common during the warm spell.
In the end, January averaged -13.7°C, tied with 2010 for 19th warmest since 1873.
Overall, it was a very dry winter. Only about 31 mm of precipitation fell from December to February, the 9th driest winter on record since 1872. 44.4 cm of snow fell, the 29th least snowy winter.
#8 – A Summer of High Humidity
With an average dewpoint of 13.6°C (June to August), summer 2015 tied with 1996 for 4th most humid summer on record in Winnipeg since 1953. 22 days from June to August saw dewpoints exceed 20°C, the 2nd most since 1953 and well above the normal of 10 days.
Dewpoint temperatures in July specifically averaged 16.1°C, the 2nd most humid July and month on record since 1953. The 1981-2010 normal is 14.2°C. An 8-day streak with dewpoints over 20°C occurred mid month. A maximum dewpoint of 24.1°C was achieved on July 12, breaking the old record of 23.9°C in 1955 for the day. 14 days saw dewpoints over 20°C, tied with 1957 for most on record in July since 1953.
A 5-day heat wave hit southern Manitoba in mid August. Temperatures exceeded 30°C and on some days 32°C. August 14 was the hottest day with some records broken, including in Brandon with a high of 36.6°C. Four days with dewpoints over 20°C accompanied the heat wave. Dewpoint temperature peaked at 24.5°C in Winnipeg on August 15, shattering the old record of 21.7°C in 1972 for the day. It was also the latest occurrence of dewpoint over 24°C since 1953. High minimum temperature records were also broken in Winnipeg (21.2°C) and Morden (22.0°C).
#7 – Summer in September
September began with a three-day heat wave as temperatures exceeded 30°C and in some cases 32°C. Oppressive humidity accompanied the heat which is unusual for September. The main records broken during the heat wave are listed below. Note: temperature records go back to 1872 while dewpoint and humidex records go back to 1953.
- Record high minimum of 21.0°C on the 3rd was also the second highest in September.
- Two high dewpoint and three high minimum dewpoint records were broken, including:
- High dewpoint of 23.1°C on the 3rd was also just shy of the all-time September high of 23.4°C in 1983 and was the second highest in September.
- A high minimum dewpoint of 18.7°C on the 3rd was also an all-time high for September.
- Humidex reached 42.0 on the 3rd, the second highest in September. This, along with a humidex value of 40.1 the previous day, were only two of six occurrences of humidex over 40 in September since 1953.
Strong thunderstorms on the 4th and 5th ended the heat wave with a bang. Severe storms between 1 and 8 am on the 4th dropped dime to toonie size hail southeast of Winnipeg and northwest of Minnedosa. Strong thunderstorms moved up the Red River Valley in the afternoon. The Winnipeg area saw 30 to 50 mm of rain in under an hour, causing severe street flooding. Wind gusts over 80 km/h also caused some damage. With more rain later on, daily totals sat between 40 and 60 mm. The airport recorded 41.1 mm, breaking the record of 36.8 mm in 1872. Heavy thunderstorms moved up the Red River Valley again on the 5th, dumping 15-40 mm of rain southeast of Winnipeg.
Another 30°C day occurred on September 13. Winnipeg reached 31.6°C, just shy of the record of 31.7°C in 1927. Records were broken along the US border including in Morden and Pilot Mound where highs of 33.8°C and 33.3°C occurred.
It was the 6th warmest September on record since 1872 in Winnipeg with an average mean temperature of 15.8°C. It was also the second warmest since 1949. Dewpoint temperatures averaged 9.8°C, the 3rd most humid September since 1953.
#6 – A Very Early Spring
April-like temperatures arrived by the second week of March. Record highs were achieved on the 14th and 15th. Winnipeg reached 13.2°C on March 14, breaking the old record of 11.4°C in 1981. A high of 14.3°C the following day was just shy of the record of 14.4°C in 2012. The warmest temperatures occurred along the US border. Morden reached 18.3°C on the 14th and 17.6°C on the 15th, the earliest occurrences of temperature over 16°C on record since 1904. The high of 18.3°C on March 14 broke the old 2012 record by an impressive 7.1°C! Nights were unusually mild as well. A morning low of 6.7⁰C in Winnipeg on March 15 was the warmest morning low for so early in the year since 1953.
The winter snow pack disappeared in Winnipeg by March 15, tied with 1995 for third earliest snow melt since 1955. This was a day later than in 2012 and a day earlier than in 2010.
In the end, March averaged -3.0°C, 2.8°C warmer than normal and the 20th warmest March since 1872. Even thunderstorms with small hail occurred on March 30 west and north of Winnipeg. No thunder was heard in Winnipeg but small hail fell in the south end with some convective showers.
#5 – Active Thunderstorm Season in Southern Manitoba
Manitoba had the greatest number of reported tornadoes and waterspouts in Canada for 2015. In addition, Manitoba had the most severe hail and severe thunderstorm rain reports of the three Prairie provinces.
At least 11 tornadoes and waterspouts occurred in Manitoba in 2015, the most in more than 5 years. Two events brought worldwide attention: at least 2 tornadoes and waterspouts on July 18 near Matlock and at least 3 tornadoes on July 27 in southwestern Manitoba(3 tornadoes were mentioned in Justin Hobson’s chase story).
On July 18, a landspout tornado near Matlock travelled over Lake Winnipeg, becoming a waterspout. The storm produced at least one other waterspout and they occurred simultaneously. The storm and funnels were photogenic and photos spread around the world on social media.
On July 27, a supercell travelled over 100 km from Tilston to northeast of Virden, producing multiple tornadoes in a 3-hour timeframe. Some were violent as seen on videos. One tornado reached about a kilometre wide. Luckily, the tornadoes dodged all major communities.
Only a few farms and highways experienced damage. Environment Canada sent a damage survey team to investigate. The worst damage they saw was from a high-end EF-2 tornado (winds close to 200 km/h). It is entirely possible that the tornadoes may have been even stronger, but because they weren’t hitting anything significant it is impossible to tell.
Hail was also a big story this summer across southern Manitoba. The greatest proportion of severe hail reports were in August thanks to extreme nocturnal activity mid and late month. Significant hail events occurred on August 12, 22 and 28.
Along with parts of southern Alberta, southern Manitoba had the greatest concentration of severe thunderstorm warning days as seen in the map below. The Minnedosa warning region of southwestern Manitoba saw 19 days in 2015 with a severe thunderstorm warning, the most of all warning regions in Canada.
#4 – May Long Weekend Storm
A Colorado Low slammed southern Manitoba during the May Long Weekend. Heavy rain, damaging wind, large waves on the lakes and snowfall occurred.
The rain in Winnipeg began late on Saturday May 16 and persisted the entire day on Sunday May 17. 35-50 mm fell in the city. 31.3 mm fell at Winnipeg airport on May 17 alone, breaking the old record of 22.9 mm in 1903 for the day. Heavier rains fell to the southwest with 50-90 mm from Morden to Carman to Melita. Significant overland flooding occurred with many farm fields underwater.


The rain was accompanied by sustained winds of 47 to 63 km/h at Winnipeg airport for 22 consecutive hours. Wind gusts were between 80 and 95 km/h. A peak gust of 93 km/h was recorded in Winnipeg. The wind damaged property, caused power outages and uprooted trees. In addition, larges waves and storm surge occurred on Lake Manitoba and Lake Winnipeg.
On Monday May 18, snow and strong wind occurred. Snow fell throughout the night, ending in the morning. The cold and wind combined to produce wind chill values of -9. Between a dusting and 3 cm of snow fell in Winnipeg, depending where you were. 2.5 cm was measured in Charleswood on May 18 alone, just shy of the old record of 3.0 cm in 1963. A snow depth of 2 cm in the morning observation broke the old record of trace cm. The snow melted in the afternoon. This was the latest spring snowfall in Winnipeg since 2002 when a trace cm fell on May 23 and the latest snowfall accumulation since 1969 when 0.3 cm fell on June 12. Prior to this year, snow had fallen on May 18 only 4 times since 1872. Heavier snow fell west of the city with a swath of 10-15 cm from Boissevain to McGregor to Teulon to the Gimli area.
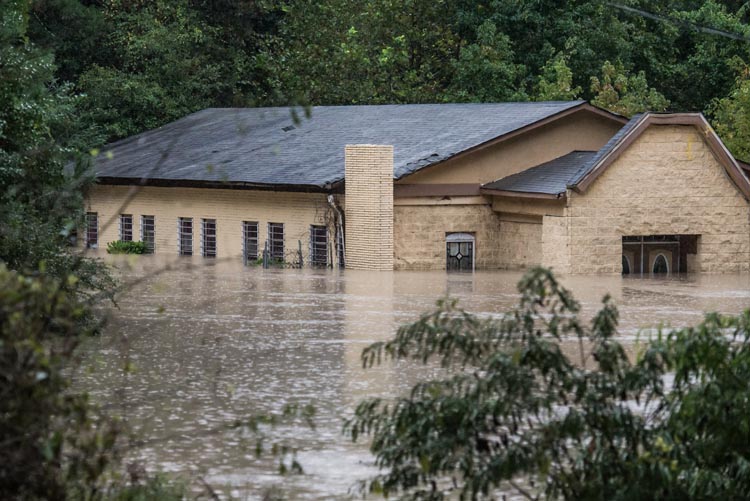
#3 – August 22-23 Severe Thunderstorms and Heavy Rain
Significant thunderstorms and heavy rain pummelled Winnipeg and the surrounding area on August 22 and 23. Due to extreme nature of the event and the large area affected, the event is considered number three in the Top 10 series.
The event began overnight on August 22 when severe thunderstorms developed north of a warm front. The bulk of the storms remained north of Winnipeg, sparing the city from the worst of the event.
The city got a spectacular lightning show, while the cottage-country north of Winnipeg and a few towns northwest of the city took the brunt of the storms. Very large hail fell from Westbourne to Teulon to Matlock to Beaconia to Silver Falls. The largest hail stone reported was 10 cm in diameter, located near Silver Falls. Significant and widespread damage occurred as a result. Locally 40-50 or more mm of rain also fell within an hour, causing overland flooding. The following table gives a chronology of storm reports from the event.
| Approx. Time | Location | Event |
|---|---|---|
| 2:00 am | Westbourne | Nickel to golf ball size hail. |
| 4:15 am | Teulon | Quarter size hail with significant accumulation. Tree, garden and vehicle damage occurred. 43 mm of rain in 1 hour caused overland flooding. Mounds of hail still remained on the ground hours after the storm. |
| 4:45 am | Matlock | 5 cm diameter hail. |
| 5:15 am | Grand Marais | Gold ball size hail. |
| 5:30 am | Beaconia | Baseball size hail punched holes in roofs and totalled almost every vehicle left outside during the storm. 50+ mm of rain also fell within an hour. |
| 5:45 am – 6:00 am | Pine Falls, Powerview and Silver Falls area | Nickel to softball size hail. One photo showed a 10 cm diameter hailstone. |
Heavy thunderstorms developed again midday in the Red River Valley. Winnipeg was particularly hard hit by these. 50 mm fell in less than 1 hour in parts of the south end. Nickel to toonie size hail, wind gusts to 80 km/h and frequent lightning also occurred, making for quite a storm to remember. Numerous streets and underpasses flooded and some were impassable. Water seeped into and flooded parts of St Vital Mall. Lightning caused a few fires and wind snapped branches.
The afternoon thunderstorms also dumped some large hail in other areas. Nickel to quarter size hail fell in Oakbank, Winkler and Jessica Lake. Training thunderstorms continued to pummel southeastern Manitoba late afternoon and evening, dumping significant rainfall. Rain from these also spread into the Winnipeg area and Red River Valley. Wrap-around rain around the low pressure system continued to drench south and southeastern Manitoba in the overnight and morning on August 23. Two-day rainfall totals were significant. Widespread totals of 50 to 110 mm occurred throughout the Red River Valley, southeastern Manitoba and the Interlake. In Winnipeg, close to 75 mm fell in southern sections of the city. At Winnipeg airport, about 46 mm fell. 38.4 mm of this fell on August 22 alone, breaking the old record of 38.1 mm in 1959 for the day.
#2 – Warm and Moist Fall
All three fall months (Sep, Oct & Nov) finished in the top 30 warmest on record since 1872 in Winnipeg: September was 6th warmest, October tied 30th warmest and November tied 16th warmest. It was the 4th warmest fall on record since 1872 with an average mean temperature of 7.3°C, tied with 1953 and 2009. Brandon also had a 4th warmest fall on record (since 1890), averaging 6.2°C.
In October, the warmth peaked during the Thanksgiving weekend. Record warmth was seen along the US border with highs near 28°C in Pilot Mound, Morden and Sprague. Winnipeg reached a non-record maximum of 24.6°C on the 11th. Even some weak thunderstorm activity occurred in the evening on the 11th, ahead of a strong low pressure system which produced damaging winds the following day.
A 25-consecutive day streak of above normal temperatures occurred from October 26 to November 19. During this time, 10-consecutive days from October 27 to November 5 never dropped below freezing. Warmth and humidity returned mid November before winter-like conditions arrived. Temperatures exceeded 10°C from the 14th to 16th with a maximum of 13.1°C on the 15th. Unusually high humidity also occurred with dewpoints reaching 9.4°C on the 16th and 9.3°C on the 17th, both record highs and the latest occurrences of dewpoint over 9°C on record since 1953. Thanks to the high humidity, a record high minimum temperature of 5.3°C was achieved on the 16th, the latest minimum above 5.0°C since 1872.
Dewpoint temperatures averaged 3.2°C in fall 2015, t he second most humid fall on record since 1953. November dewpoint temperatures in particular averaged -2.9°C, the highest on record, beating the old record of -3.0°C in 1981.
Thanks to warm conditions, the first accumulative snowfall was on November 18 in Charleswood, Winnipeg’s official station for snowfall. This was the 4th latest first snowfall accumulation of the season since 1872. It was also a month later than the normal of October 18. In addition, no snowfall was recorded in October, only the 16th time this has occurred since 1872.
#1 – Amazingly Warm Start to December
Remarkable warmth started December across southern Manitoba. 8 to 10 days in the first half of the month exceeded the freezing mark in Winnipeg, above the normal of 4 days for the month. 14-consecutive days from the 3rd to 16th never dropped below -9°C at Winnipeg airport, amazing when you consider this was close to the normal high. Temperatures reached 7°C downtown and 4°C at the airport on the 3rd, one of the warmest days of the month. The only record broken during the warm spell was on December 9 when a high of 5.6°C at the airport broke the old record of 5.1°C in 1990.
The warmth was most impressive where there was no snow cover. 3 to 7 cm of snow was leftover from November in the Winnipeg area and this limited temperature. Areas without snow cover southwest of the city and in southwestern Manitoba were much warmer. Many locations reached double digits and in some cases more than once. In Morden, four days exceeded 10°C, three of which were record highs. The high of 14.2°C on December 4 was the third warmest on record in December since 1904. Some thermometers reportedly reached 15°C, more typical of late September or early October. No snow was on the ground at the time. A similar milestone was reached in Brandon with a high of 11.1°C on the 4th, the third warmest temperature in December since 1890.
The first half of December (December 1 to 15) averaged -3.0°C at Winnipeg airport, the second warmest first half of December on record since 1872. The warmest was in 1913 with an average of -2.1°C. The month as a whole averaged -8.1°C, tied with 2011 for 9th warmest December since 1872.
[raw_html_snippet id=”winnipeg & area’s top 10 weather stories of 2015″]